The Personal Story of Dr. Robert G. Spiro’s 60-Year
Battle with Type 1 Diabetes
Living a Full Professional and Personal Life while Controlling Blood Glucose
Compiled from Robert's records in 2016 by Mary Jane Spiro, Ph.D.
In 2010 when Robert had 56 years of diabetes he wrote a brief description of his life with diabetes and offered suggestions to individuals with this condition. The content of these two previous websites (on Comcast.net, no longer available) is presented at www.maryjanespiro.net
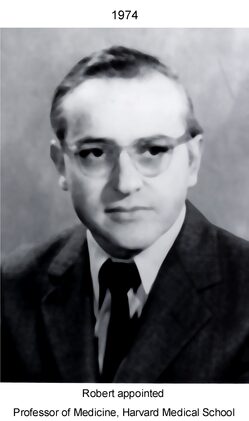
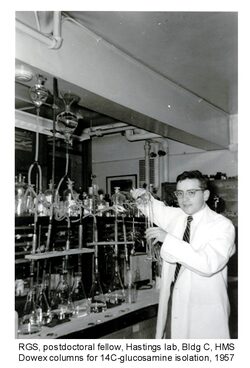
1974, 20 years of diabetes
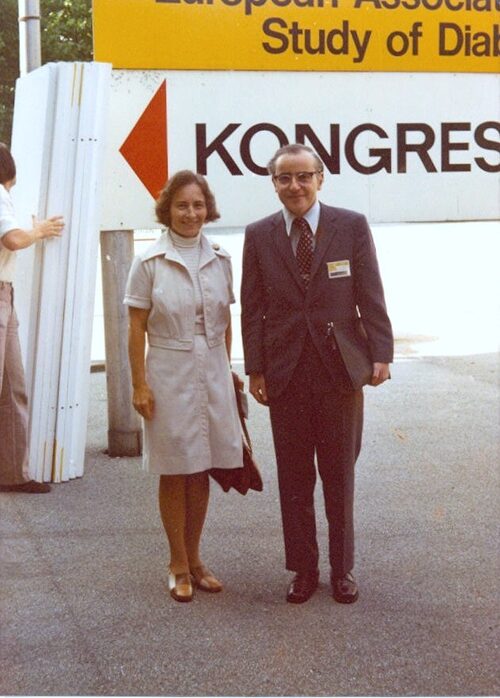
1975, Robert Awarded Claude Bernard Award, European Diabetes Association
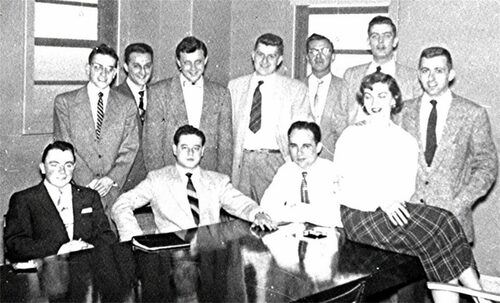
October (2014) Lifetime Achievement Award, Joslin Diabetes Center, 60 years of diabetes
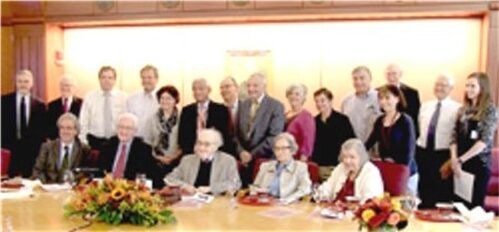
Seated, Dr. Alessandro Doria, Dr. Donald Barnett, RGS, MJS, Dr. Donna Younger
Back row: Drs. Smith, Gabbay, Aiello, Schoelson, Goldfine, Ganda, Wolpert, Rossini, Bonner-Weir, B. Krolewski, A.Krolewski, Laffel, Weir, Horton, Far right Stephanie Edwards
CONTENTS
Section I Overview (Diagnosis and Robert’s Protocol for Handling his Diabetes)
Section II Living a Full Life despite Diabetes
Section III Representative Notebook Pages (1955-2014)
Section IV* Methods and Calculations
Section V* Detailed Graphs
Section VI Robert’s Philosophical Approach to Diabetes
Section VII* Research and Academic Activities
*Sections IV, V and VII give detailed data and may be of interest primarily to professionals working with patients with diabetes
Contact: spiro.maryj@gmail.com

Section I – Overview
Robert developed diabetes in 1954 as a senior in medical school. He dealt with this illness for more than 60 years and maintained tight control of his blood sugar. This allowed him to come through this ordeal with none of the debilitating complications usually observed with this disease. In October, 2014, the Joslin Diabetes Center held a special luncheon in his honor at which they presented him with a Lifetime Achievement Award, both for his research on the complications of diabetes and for his own experiment with the importance of good control. Unfortunately in December of 2014 he was diagnosed with stage four stomach cancer and lived five more months with this devastating condition before he died on May 16, 2015.
During his 45-year career at Harvard Medical School, where he attained the position of Professor of Biological Chemistry in the Department of Medicine, he was engaged in a very demanding schedule of teaching and scientific research carried out first at the Massachusetts General Hospital and then for many years at the Joslin Diabetes Center in Boston.
Robert was married to a fellow student in 1952, two years before onset of his diabetes; he and his wife, Mary Jane, celebrated their 62nd anniversary in June of 2014. They had two sons and five grandchildren.
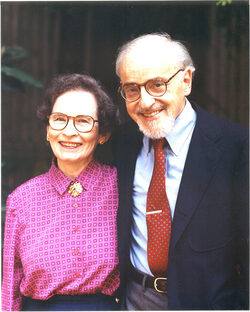
50th Anniversary of Robert and Mary Jane, 2002
As a physician and scientist he brought a unique perspective to the handling of type 1 diabetes. The extensive records which he kept from the beginning permit an analysis of daily, monthly and yearly trends in blood sugar control, insulin requirement and hypoglycemic episodes. Representative pages from each of the 60 years will be presented as well as average daily fasting blood sugar values, insulin dosage and hypoglycemic episodes and monthly and yearly averages of these values.
Diagnosis
In the late summer of 1954, between the junior and senior years of medical school, Robert was working in a research laboratory at the Medical School in Syracuse (State University of New York, Upstate) studying the effect of alcohol on the livers of mice. Mary Jane, having switched from the M.D. to the Ph.D. program at the same institution, was working on her doctoral research project and usually left work earlier than Robert (around 5:30) so that she could be home to make supper. When Robert came home and climbed the stairs to their 2nd floor flat, he always felt miserable and was irritable until he had eaten something. With his knowledge of medicine, his symptoms sounded to him like an adrenaline excess and with the advice of Dr. Richard Lyons, head of the Department of Medicine, samples were sent off to a specialty lab to test for an adrenal medullary tumor (pheochromocytoma). These results came back negative, leaving his symptoms unexplained at that time. Subsequently, hypoglycemia predating the diagnosis of type 1 diabetes was described by investigators at the University of Michigan Medical School (Conn, J.W., Fajans, S.S. and Seltzer, H.S. Diabetes, 1956 5:437-42. Spontaneous hypoglycemia as an early manifestation of diabetes mellitus.)
During the course of his senior year with its demanding schedule of Surgery and Obstetrics clerkships, both of which involved long hours of standing during the procedures, Robert lost a considerable amount of weight. The stress of these courses was heightened by the fact that he had been born with a congenital heart defect, a situation of which he was not aware until the second year of medical school during the study of Pathology. The septum between the two upper chambers of his heart, the atria, had not closed appropriately during development, allowing a large part of the oxygenated blood from the lungs to flow back into the right atrium, causing excess work for the right ventricle leading to its substantial enlargement. A trip to Boston in 1953 to consult Dr. Alexander Nadas, a specialist in this defect at the Children’s Hospital, produced the unpleasant prognosis that with luck he would live to about age 35.
Eventually, the cause of both his pre-meal irritability and his weight loss became apparent during the Christmas to New Year break (1954-55). This is the period in the career of a medical student that interviews for an Internship are conducted and Robert and Mary Jane travelled to Boston and New Haven to visit Harvard and Yale. During this trip Robert exhibited an incredible desire for sweets, including the box of chocolates that his mother, Kate, had sent Mary Jane for Christmas. Ordinarily Robert did not eat candies, or between meal snacks of any kind. Moreover, his vision became blurred, making it difficult to drive. Analyzing these various symptoms, Robert came to the conclusion that he must have developed diabetes.
Robert (back row far left with medical school classmates) had lost so much weight that his jacket was much too large.
Upon returning to Syracuse and work at the hospital he immediately went to the lab and tested his urine for sugar, obtaining a strongly positive result. Upon reporting this finding to Dr. Lyons, who was already familiar with his congenital heart condition, Robert was told that it was very common for medical students to believe that they were suffering from the diseases they were learning about and it was very unlikely that he had both the heart defect and diabetes. Nevertheless, Dr. Lyons had blood drawn for glucose determination and when the results came back extremely elevated he admitted Robert to the hospital to stabilize his diabetes.
Treatment of his diabetes was however complicated by the fact that Robert had still another condition (termed Gilbert’s disease), the hereditary lack of the liver glucuronic acid transferase that changes bilirubin (formed from hemoglobin during normal red cell destruction) into a soluble form for excretion in the bile. The unmodified and poorly soluble bilirubin had formed small, hard stones in the gall bladder, leading to pain upon eating any food containing fat, particularly meat. For this reason Mary Jane had altered their meals to contain less protein and more carbohydrate, a regimen not ideal for handling diabetes. Therefore Dr. Lyons recommended surgery for gall bladder removal, which was performed.
1950’s concept of diabetes treatment
As Robert recovered from the surgery that removed his gall bladder, many members of the faculty of the medical school stopped in to see him and offer encouragement. The head of the psychiatry department informed him that he should consider the insulin syringe “the instrument of resuscitation”. The main theme of the doctors’ messages was that diabetes was really no problem - if Robert took his daily insulin everything would be fine. He should not worry about strict control, especially since many experts felt that overemphasis on control would have serious consequences on mental health. This was the concept preached in particular to parents of young children and to teenagers with the disease in the 1950’s, an era when the mental health of the individual was felt to be unable to withstand any trauma.
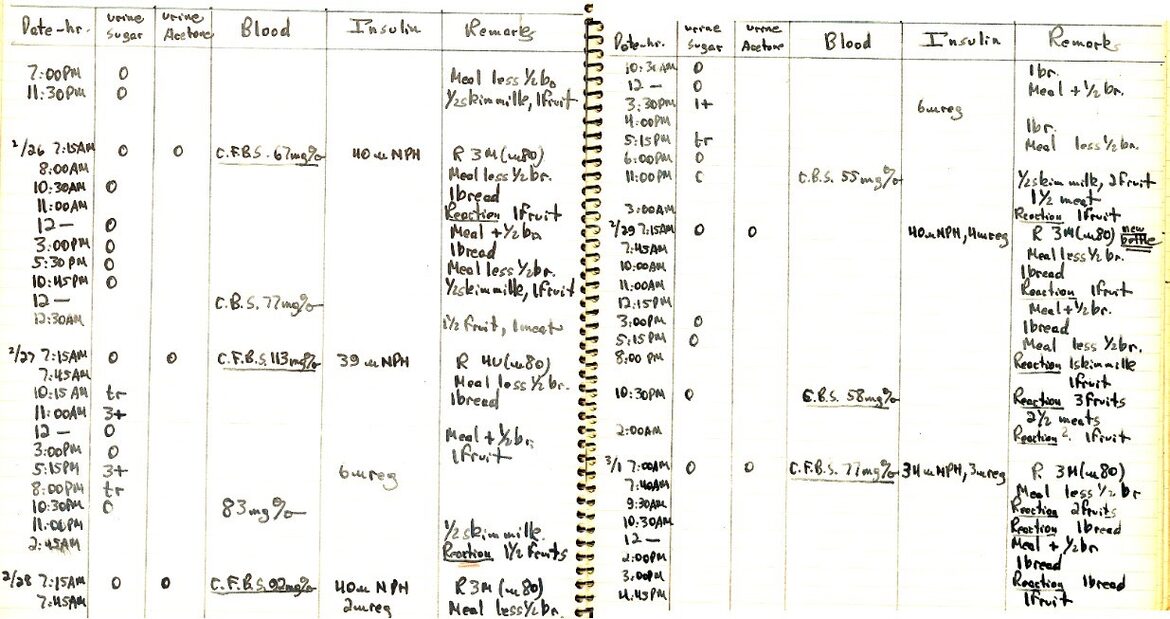
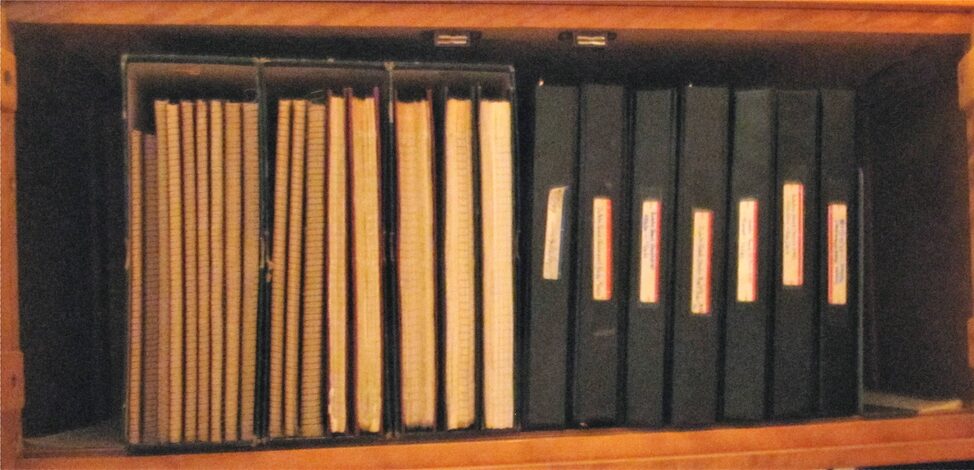
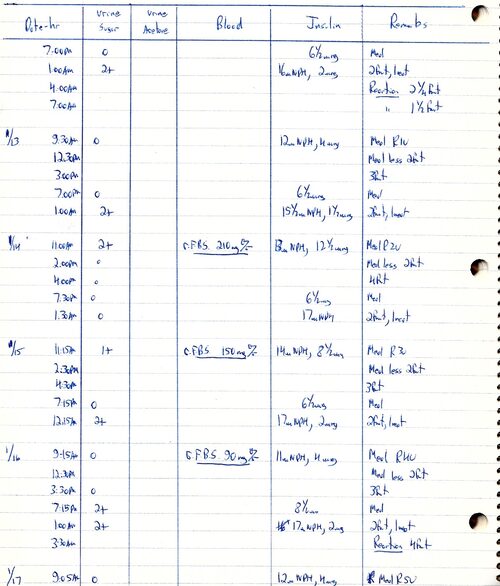
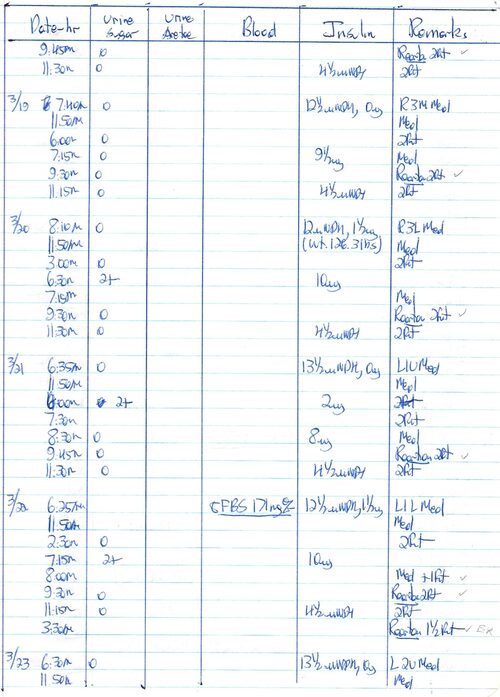
However, Robert in the course of his studies, in particular while writing an honors thesis for the pharmacology course, had consulted the writings of Dr. Elliott P. Joslin of Boston whose message was quite different, stressing the importance of normalizing blood sugar. Joslin's three-word slogan, insulin, exercise, diet, provided a framework for the treatment of the disease. Robert therefore after recovering from the gall bladder surgery embarked on a regimen that he maintained for over 60 years of diabetes: a diet was established and adhered to (weighing foods when at all possible), insulin was administered several times a day and a daily record was kept that now amounts to more than 10,000 pages. The figure below shows sample pages from the records kept in 1956.
In Table 1 some details are given of the insulin type used over the years as well as the timing of the injections. In addition to those scheduled in the morning, at supper and before bedtime, injections were made at other times of the day based on the urine sugar determined using first Clinitest, then Tes-Tape and later the blood sugar determined by dextrostix or glucometer was used to determine insulin dosage. Although fasting blood sugars were determined in our home laboratory, each determination took much too long for use during the work day. Regular insulin was added to the morning and evening NPH if blood sugars were elevated or urine sugars were positive. The times varied somewhat from day to day.
Table 1 Schedule of daily Insulin injections
|
|
|
|
|
|
|
|
|
|
|
|
|
|
|
|
|
|
|
|
|
|
|
|
|
|
|
|
|
|
|
|
|
|
|
|
|
|
|
|
|
|
|
|
|
|
|
|
|
|
|
|
|
|
|
|
|
|
|
|
|
|
|
|
|
|
|
|
|
|
|
|
Blood glucose measurements
However, since urine sugar represents an average of the amount collected in the bladder over a period of time and does not reflect the current situation of blood sugar, Robert determined to set up a home blood glucose measuring technique. Since Mary Jane was training as a biochemist she was aware of procedures for determining blood sugar on a “micro” scale. Actually the techniques available at that time (1954-55) required about 200 microliters (several drops) of blood while today’s glucometers can perform the test on less than 1 microliter. Most commonly used at that time was the Nelson-Somogyi procedure (Somogyi, M., A New Reagent for the Determination of Sugars, J. Biol. Chem., 1945, 160, 61-68). After a finger puncture, the 200 microliters of blood obtained were placed in a small glass tube (especially shaped using the oxygen torch in the laboratory) and reagents were added to precipitate the blood proteins. This required spinning the tubes in a home-made centrifuge fashioned by Mary Jane’s brother, Bill Paisley, from a 78 rpm turntable fitted with a wire hanger bent to hold the tubes. A measured amount of the clear supernatant was then added to a Pyrex test tube, measured amounts of the color producing reagents were added and the tubes capped with marbles were boiled for a specific time using an immersion heater in a Pyrex measuring cup. The color was originally compared visually to standards run at the same time, but when an outdated colorimeter was being discarded at the lab, it was brought home and the color measured precisely. This technique was so cumbersome that it consumed a half-hour every morning.
In 1964 Miles Laboratories (now Bayer) developed a new product called “Dextrostix”, paper strips that contained the enzyme glucose oxidase and color reagents. After the drop of blood sat for a minute on the paper it was washed off with water, blotted and the color compared to a chart of colors to determine the glucose concentration (Fig. 3) When Dextrostix came on the market, Robert compared his readings from the color chart with those obtained using the Somogyi method. After a period of learning how to determine the approximate value from the color chart (compared to the determination by the Somogyi technique), Robert was able to use the Dextrostix for following his diabetes control, not only in the morning but during the day. As will be seen from the picture, the method was most reliable between 25 and 130 mg/dl and served to alert him to low blood glucose values as well as to any very high ones in order to adjust his insulin or snacks accordingly.
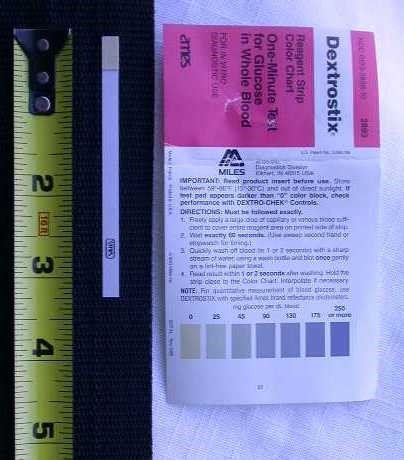
Fig. 3 Dextrostix color chart for determining blood glucose values
The values above the colors are 0, 25, 45, 90, 130, 175 and 250
In 1969 the Ames company (now Bayer) developed the “Reflectance Meter” which read the color on the washed Dextrostix strip and provided very accurate values for the blood glucose. By keeping one meter at home and another at his laboratory, Robert was able to keep a close watch on his blood sugar at all times of day. This meter also played a critical role in the 1971 operation that repaired the hole between the upper chambers of his heart. By the 1970’s the risk of mortality during open heart surgery had been reduced to an acceptable level; in addition, Robert’s heart had started to decompensate, leaving him gray-faced and out-of-breath after a short walk, as had been predicted by Dr. Alexander Nadas, the Boston cardiologist who had given the pessimistic prediction of a life-span of 35 years. Therefore when Robert was 42 (February, 1971), Dr. Gerald Austen, head of surgery at the Massachusetts General Hospital, attached Robert to a heart-lung machine (in order to pump blood through his body while the heart was open) and placed a Teflon patch over the hole in the septum between the two atria, at the same time redirecting the misplaced pulmonary veins so that their blood flowed into the left atrium as it should. This was a very time-consuming operation and it was critical to know the blood sugar so that there would neither be hypo- or hyperglycemia. Therefore, Dr. Donald Martin, a colleague and friend working at the Massachusetts General Hospital, undertook the task of monitoring the blood sugars repeatedly during the operation using the reflectance meter, despite the fact that diabetologists are not ordinarily exposed to the amount of blood present at this operation. At one point he emerged white-faced from the operating room, his appearance convincing Mary Jane that Robert was dead. Fortunately, Dr. Martin soon recovered his color and assured her that all was going well.
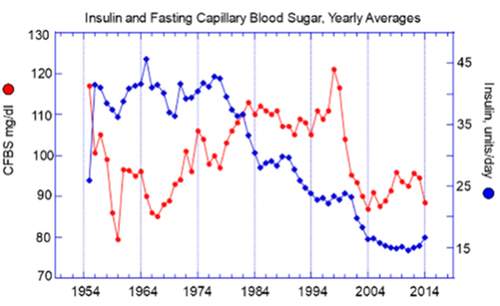
Figure 4
60 years of blood glucose determinations
Figure 4 shows the yearly average of early morning fasting blood sugars, performed as described above, initially by the test-tube Somogyi method, next with Dextrostix using the visual estimation method and then by more exact determination with the Ames reflectance meter. After 1985 a number of “Glucometers” were used with increasing sensitivity and requiring less and less blood for accurate determinations. Also shown in this figure are the yearly averages for daily insulin dosage, reflecting the early so-called “honeymoon period” of low insulin requirement shortly after onset of the disease, followed by many years with an average of about 40 units per day. Between years 20 to 40 years of diabetes, the insulin requirement decreased to about 23 units per day and after instituting use of the insulin pump in 2001 dropped precipitously to about 15 units per day, with spikes due to illness of stress.
Many factors influence the amount of insulin required by the body, among which the number of calories consumed per day is of great importance. In Table 2 typical diets are shown for several years from 1957 to 2014. During this period the carbohydrate and protein calories consumed decreased by 36% by 2000; some of the pre-insulin pump decline in dosage can therefore be ascribed simply to decreased food intake. The decline with pump use probably reflected a decreased degradation of insulin because of its limited time of exposure to proteolytic enzymes at the injection site due to the constant infusion of small amounts.
Diet
Table 2. Changes in daily diet with time
|
|
|
|
|
|
|
|
|
|
|
|
|
|
|
|
|
|
|
|
|
|
|
|
|
|
|
|
|
|
|
|
|
|
|
|
|
|
|
|
|
|
|
|
|
|
|
|
|
|
|
|
|
|
|
|
|
|
|
|
|
|
|
|
|
|
|
|
|
|
|
|
|
|
|
|
|
|
|
|
|
|
|
|
|
|
|
|
|
|
|
Hypoglycemia
Attempting to maintain normal blood glucose is an extremely difficult task for the type 1 diabetic. The normal pancreas turns on insulin secretion in response to elevated blood sugar levels and turns it off again as the glucose decreases. Occasionally the normal person, after consuming a high-carbohydrate meal, may feel a brief period of discomfort when the glucose level falls rapidly below normal, but at such a time glucagon will be secreted by the pancreas leading to release of glucose into the blood from the liver glycogen.
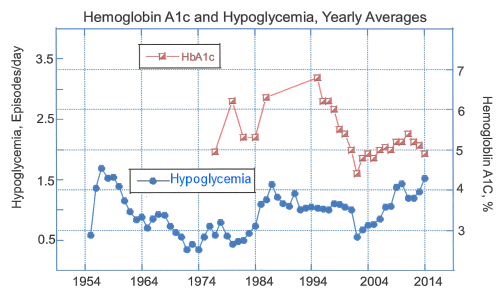
Figure 5
In the type 1 diabetic pancreas the cells producing insulin have been destroyed and the cells producing glucagon have a compromised response to low blood sugar so that control is dependent on injected insulin to lower the blood glucose level and ingested carbohydrate to raise it when necessary. Since many factors determine how much insulin is needed on any day (including the amount of exercise, the degree of stress, changes in timing or amount of food consumed), the amount of insulin injected or programmed into the pump may be either too little or too much. While the high blood glucose (hyperglycemia) accompanying inadequate insulin is very dangerous in the long term because of tissue damage leading to the diabetic complications, the results of low blood sugar (hypoglycemia) are more immediate and uncomfortable, being expressed initially as a feeling of unease and irritability. If not corrected by ingestion of carbohydrate the hypoglycemia can lead to unconsciousness or even death. Presently the condition is designated by any blood glucose measurement under 75 mg/dl. Therefore, the best defense against hypoglycemia is the performance of multiple glucose measurements during the day, and in particular when experiencing any of the above-mentioned uncomfortable sensations. In the fourteen years during which he used an insulin pump Robert routinely performed multiple glucose measurements every day and adjusted his insulin or ingested carbohydrate as required. Despite these measurements he nevertheless had many hypoglycemic episodes, fortunately none in his 60 years of the disease led to unconsciousness or hospitalization for this condition. Figure 5 shows the yearly averages of the daily low blood glucose incidents, which varied from 0 to in some cases to as many as 5.
Hemoglobin A1c
At the present time the most reliable estimate of the degree of blood glucose control is the hemoglobin A1c measurement. Since the red blood cells have a life span of about 120 days, the oxygen-carrying protein within them, hemoglobin, is exposed for about 4 months to the glucose in the blood. By a chemical reaction a sensitive position in the protein is modified by addition of a glucose molecule and this changed protein can be determined in the laboratory. The normal person’s modified hemoglobin represents from 4 to 6% of the total hemoglobin. It has been recommended that the level of the A1c be maintained below 7% to avoid the diabetic kidney and eye complications, but a poorly controlled diabetic may have values ranging up to 14 or 15%. Figure 5 shows the average values obtained (usually from two samples per year) for Robert’s hemoglobin A1c, beginning in the late 1970’s when the method became available at the Joslin Diabetes Center. It will be noted from the record pages presented in Section III as well as from Figure 5 in this section that Robert's elevated A1c levels (6.0 % to 7%) reflect a period when elevated blood glucose levels were more prominent. After starting the use of the insulin pump in 2001, the hemoglobin A1c values fell precipitously and stayed within the normal range. At the same time the number of low blood sugar episodes per day increased (Figure 5).
Variability of Insulin Requirement
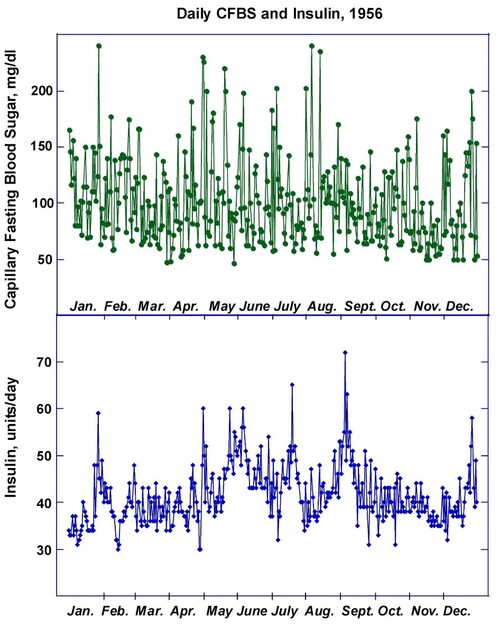
As might be expected, the amount of insulin required to maintain a close-to-normal blood glucose is not a constant. The amount of exercise, stress, eating habits, perhaps even the daily temperature seems to affect the dosage necessary. The best way to visualize this is to see the monthly averages over a period of time, as shown in Figure 6 for the decade, 1955 to 1964, where the average morning fasting capillary blood glucose is also plotted. The increasing insulin requirement in the first few months of the disease is quite apparent and is consistent with the end of the so-called honeymoon period. However, even after this increase, monthly requirements decreased or increased repeatedly.
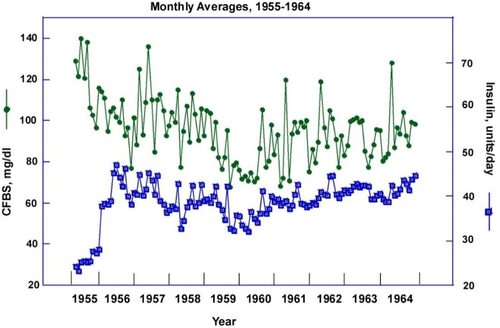
Figure 6
A similar pattern prevailed over the entire course of the 60 years of this disease, as illustrated in Figures 7 and 8 for 1959 and 1999. Although the total amount required in 1999 was much less than that in 1959 (Figure 8), the variation in daily requirement was maintained, ranging from 17 to 28 units per day over the course of the year.
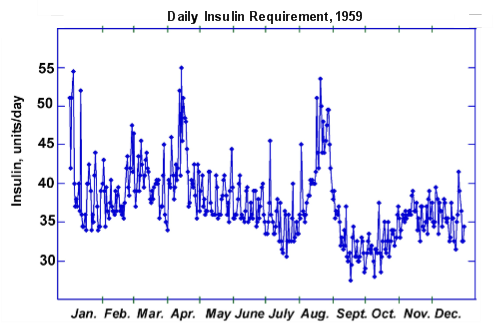
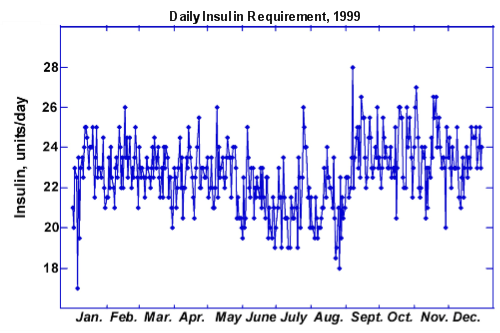
Figures 7 and 8
Influence of Insulin Pump on Insulin Requirement and Fasting Blood Glucose
Although, as has already been pointed out, Robert’s insulin requirement fell gradually after about 20 years of diabetes, the change from multiple injections to infusion of insulin via a pump resulted in a dramatic fall in the insulin dose. Figure 9 shows the monthly average for the fasting blood glucose and insulin dosage for the period from 1999 to 2011. The use of the insulin pump not only reduced the insulin requirement but also brought the morning glucose values closer to the normal range. Use of the pump, however, did not decrease the degree of variability of insulin requirement. From Figure 10 it may be seen that in 2006 the amount of insulin needed varied from 18 units per day to under 13 and the number of hypoglycemic incidents per day (not shown) ranged from 0 to 4.
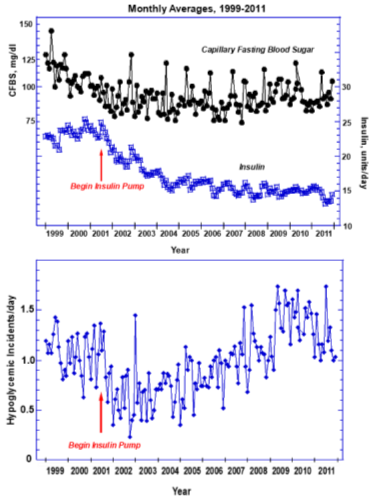
Figure 9
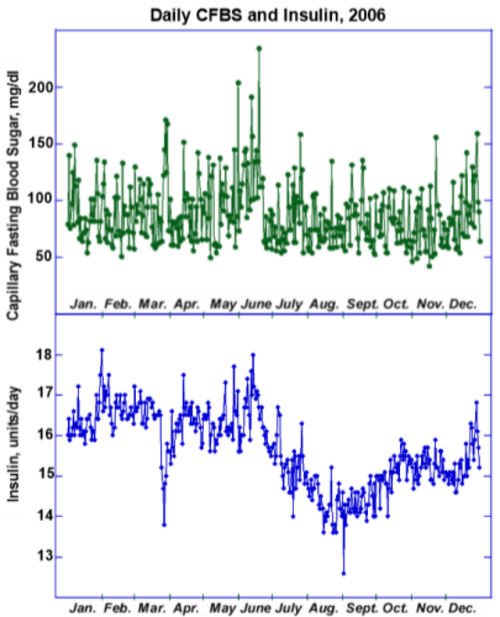
Figure 10
Coordination of Insulin Pump and Glucose Determinations
The use of the insulin pump has many advantages. Insertion of a needle into the body has to be performed only every two to three days, instead of multiple times per day. The taking of a bolus is a much more private affair, simply programming an additional dose into the pump’s computer rather than having to perform an injection. The timing of boluses to meals is much more convenient, particularly when eating away from home. However, the possibility of severe hypoglycemia mandates multiple blood glucose determinations, which does involve pricking the finger several times a day. The advantage of these numerous tests resides not only in preventing hypoglycemia but in enabling the individual with diabetes to minimize hyperglycemia by taking additional insulin, which as mentioned is much easier to do with the pump and which can be done in an incremental manner. As may be seen from Figure 11, in addition to the basal insulin which stayed at 0.4 unit/hr for most of the day, the number of additional insulin infusions (boluses) ranged from 4 to 9, depending on the glucose levels. The time notations for each day are M (midnight), 6 AM, N (Noon) and 6 PM.
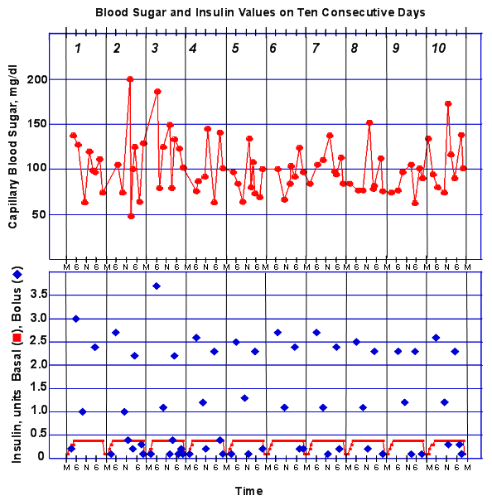
Figure 11
Summary
One prominent picture emerges from this brief description of 60 years of Type 1 Diabetes: it is a disease that can be conquered, but only with great determination and effort. This is a fact often not recognized by the general public whose concept of diabetes is that of the more easily managed type 2 that usually develops later in life and often because of poor dietary habits, obesity and lack of exercise. Robert had for several years a website describing his experience with diabetes and he often received emails from fellow diabetics or their relatives. To the mothers of children just diagnosed with the disease he was able to reassure them that it is not a death sentence and that with perseverance, the son or daughter would be able to have a long and fulfilling life. However, some of people who corresponded with him mentioned how difficult it is to make their friends and families understand how challenging the disease is. They are told “how well they look” and asked why they can’t “just once in a while” indulge in overeating. What the friends and relatives don’t seem to realize is that attempting to bring down the resulting high blood glucose is very difficult and often results in a very unpleasant hypoglycemic episode, since there is no exact formula for how much insulin to use.
Robert made substantial contributions to diabetes treatment in several ways. First, very early in his research career he started investigating the nature of the kidney complications of this disease. Prompted by previous histological findings of abnormalities in the basement membrane of the glomeruli of the kidney he developed a way to isolate these structures from animal kidneys and to prepare their basement membranes so that he could determine what caused the formation of the nodules in the glomeruli and the destruction of the filtration apparatus. Studies with diabetic rats demonstrated that the animals with this disease developed changes in their glomerular basement membranes and that treatment with insulin to normalize the blood glucose prevented or minimized these changes. These studies were the first to bring to the attention of the scientific community the possibility that elevated glucose itself could be the culprit causing the complications. In addition he lectured and wrote review articles describing the relevance of the elevated glucose to the kidney disease. And perhaps most importantly, when he was examined by the diabetes specialists at the Massachusetts General Hospital in 1971 in preparation for open-heart surgery to repair his congenital defect they were amazed that after more than 16 years of the disease he showed no signs of retinal, kidney, or nerve damage. Many changed their mind about the importance of strict control at that point. The fact that Robert took on his diabetes as a challenging self-experiment in the tradition of the many medical pioneers who had made themselves guinea pigs also had a great impact on the medical community.
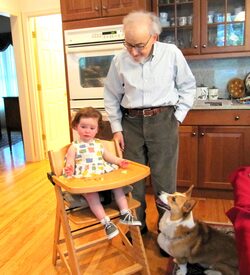
At 86 years of age Robert was still grappling on a daily basis with his diabetes, doing as many as ten finger pricks a day for blood glucose and administering small amounts of insulin whenever the sugar was elevated. Fortunately he had developed none of the possible complications of the disease, such as kidney failure, retinopathy or neuropathy but this had not made him immune to many of the usual problems associated with ageing, including a painful and debilitating spinal stenosis. He was still a very avid reader and follower of national and international events, playing chess with his wife or grandchildren, walking the active Welsh Pembroke Corgi, and listening to classical music.
In October of 2014 the Joslin Diabetes Center hosted a special luncheon for him, attended by his colleagues at the Center, at which he was presented with a “Lifetime Achievement Award”, both for his research on the causes of the complications of diabetes as well as for his own 60-year experiment with its control. Unfortunately, a few weeks later he was diagnosed with stomach cancer which he fought bravely for an additional five months. His wife and sons were with him when he died on May 16, 2015.
Section II – Living a Full Life Despite Diabetes
Robert’s experience with diabetes as a patient, physician and researcher was described in Section I of this article, but to Robert at least as important to his life was the fact that he and his family had to flee Nazi Germany and as he stated “had the good fortune, as refugees from religious persecution, to reach and settle in the United States" where he was able to pursue his education and then a career in medicine and science.  Several years ago Robert (when he had diabetes for 56 years) prepared a website called, Family and Career.  What follows is his version of his life in his own words.


I was born Günter Spiro in Berlin, Germany, in 1929 in a family which traced its ancestry to the Rhineland city of Speyer in which a vibrant Jewish community already existed in the eleventh century and at that time the town was called by the Latin name “Spira”, explaining the derivation of my family name. Because of the Nazi persecution my parents, brother and I fled to the United States where we arrived via wartime England in 1940 in a warship-protected convoy on one of the last passenger vessels to cross the Atlantic during World War II. Due to the increasing Nazi terror my parents had sent me in 1938 to a school in Gstaad, Switzerland, which I attended for two years before joining them in London . After arriving in the United States I added Robert to my name (Robert Gunter Spiro) because of the difficulty  for English speakers to pronounce the ü in my birth name.
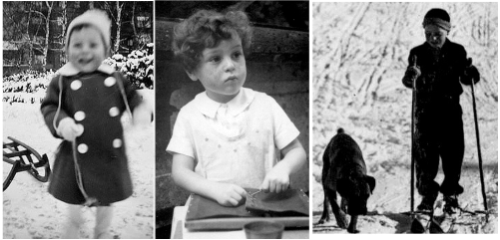 Figure 1 Robert in Berlin (left and center) and in school at Chalet Flora in Gstaad (1938) with the school dog.
I received an A.B. With Honors from Columbia College in 1951. Subsequently I attended the SUNY Upstate College of Medicine at Syracuse from which I received an M.D. degree (cum laude) in 1955. There I met my future wife, Mary Jane Paisley who was working for her Ph.D. and we married in 1952. In 1954 I developed type 1 diabetes which I have now had for 56 years. After I completed a medical internship we moved to Boston in 1956 where we have been associated with Harvard Medical School throughout our careers. I received postdoctoral training in the Harvard Department of Biological Chemistry (1956-58) and at the Massachusetts General Hospital (1958-61).
I then joined the Joslin Diabetes Center and established a laboratory devoted to the study of the diabetic kidney complications. My research on the structure and biosynthesis of the renal glomerular filter indicated that it consisted of proteins to which a complicated array of sugars are attached (glycoproteins, proteoglycans and collagens) and this greatly broadened the scope of the research on the structure, biosynthesis and biological function of these molecules which are important components of cell and basement membranes and have been implicated in a host of diseases, including cancer, virus infections, immune disorders, arthritis and various other kidney diseases: See "My Publications"
http://www.ncbi.nlm.nih.gov/pubmed/?term=spiro+rg
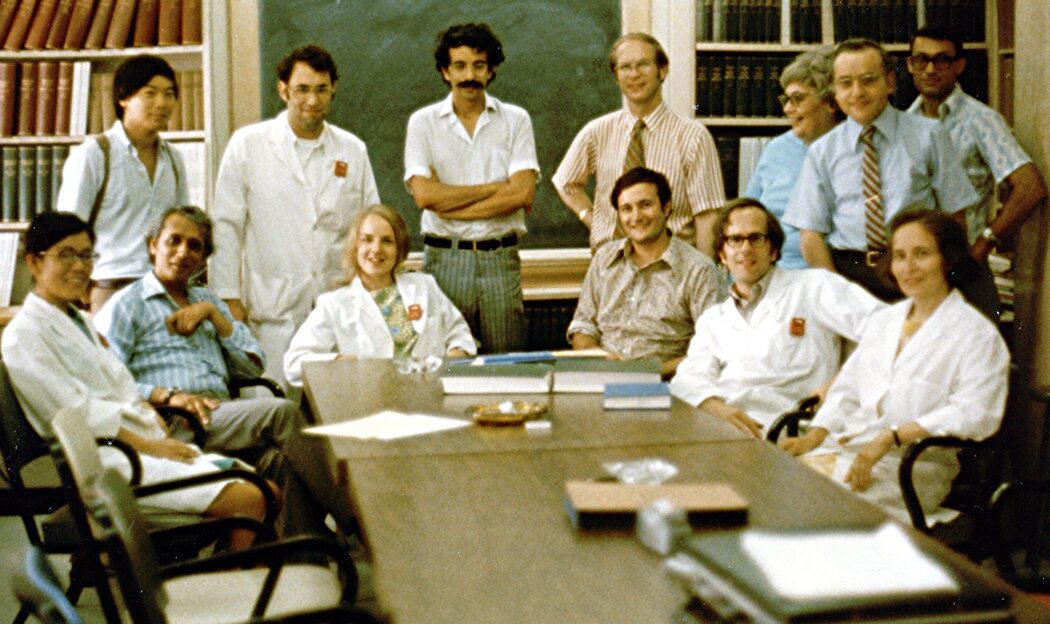
Figure 2 1973 Robert's research group at the Joslin Diabetes Center in Boston showing postdoctoral fellows from Japan, the United States (3),
England and Israel as well as Research Assistants from Mauritius and the United States.
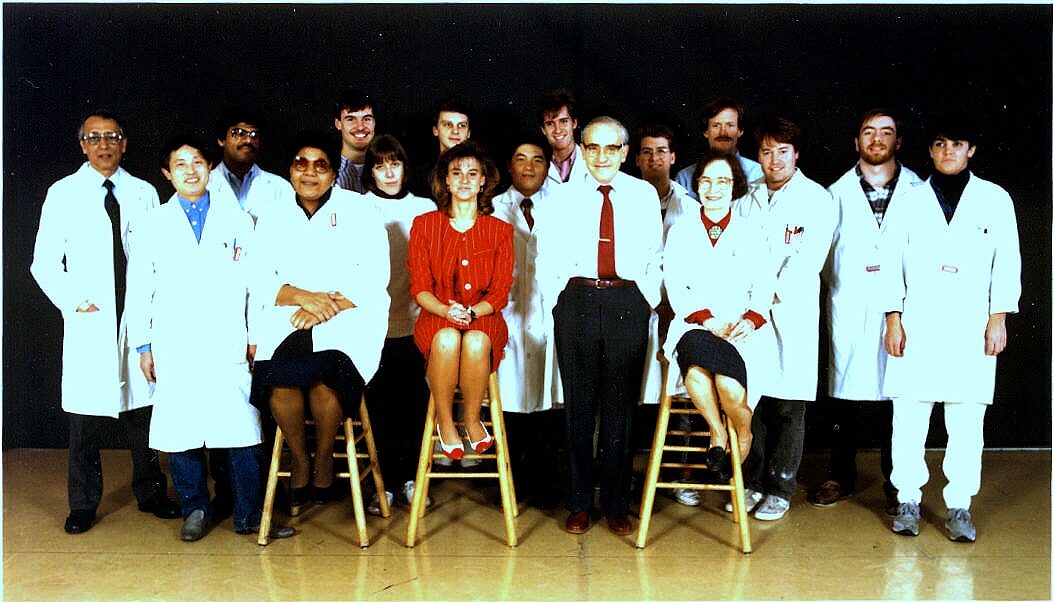
Figure 3. 1988, Glycoproteins and Biomembranes Research Group at the Joslin Diabetes Center in Boston showing postdoctoral fellows from China, India, Germany, England, Japan and the US, plus research assistants from Mauritius and the United States
Our studies on the kidney glomerulus in diabetes provided a biochemical rationale for tight blood sugar control which is now a universally accepted concept. This work was recognized by my receipt of the Lilly Award from the American Diabetes Association and the Claude Bernard Award of the European Association for the Study of Diabetes. The research on glycoproteins helped to provide seminal information and concepts to a field (glycobiology) which is still rapidly expanding because of its relevance to so many human diseases.  In 2008 the work in the latter field was recognized by the Rosalind Kornfeld Award for Lifetime Achievement in Glycobiology.


For many years I was involved in the teaching of biochemistry to first year Harvard Medical students. My laboratory during its 40 years of existence provided pre- and postdoctoral training to more than 60 individuals from many countries, a large number of whom have become leaders in their fields. In 1965 my wife joined the laboratory and many of the studies were undertaken in collaboration with her. I am currently Professor Emeritus at Harvard Medical School (Biological Chemistry and Medicine) and Senior Investigator Emeritus at the Joslin Diabetes Center where I continue to write about and follow the latest advances in diabetes and glycoprotein research.


We have two sons, David and Mark, both of whom received Ph.D. degrees in the biological sciences. They both have children, giving us the pleasure of five grandchildren.
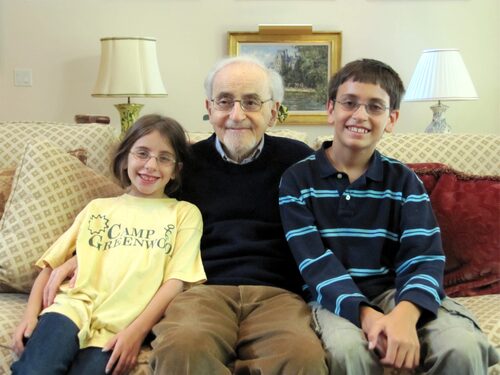
David's Children, Josh and Lily Mark's children, Aleah and Alex Mark's daughter, Porter
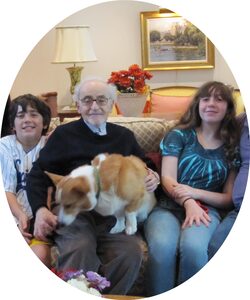
I also have a Welsh Pembroke Corgi (seen in the above pictures) who takes me for pleasant walks.
My nonscientific interests are cultural and political world history, stamp collecting, classical music and chess.
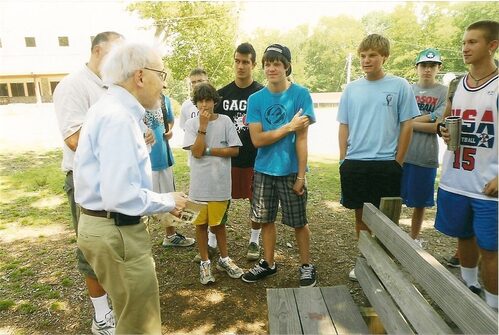
Very important to Robert was the support of the camps for diabetic boys (Joslin Camp) and girls (Clara Barton Camp), both of which are now managed by the Barton Center for Diabetes Education. He felt that the experience of learning about diabetes in an environment where all of the children faced the same problems would help them establish a life-long approach for handling their diabetes.
On the occasion of his receiving the 50-year medal from the Joslin Diabetes Center he set up an endowed fund for the Joslin Camp and he subsequently did the same for the Clara Barton Camp. In 2012 we visited the camp and the picture below shows Robert giving a pep talk to a group of campers and they are listening and appear to be interested to hear what he has to tell them.
Section III Representative Notebook Pages, 1955-2014
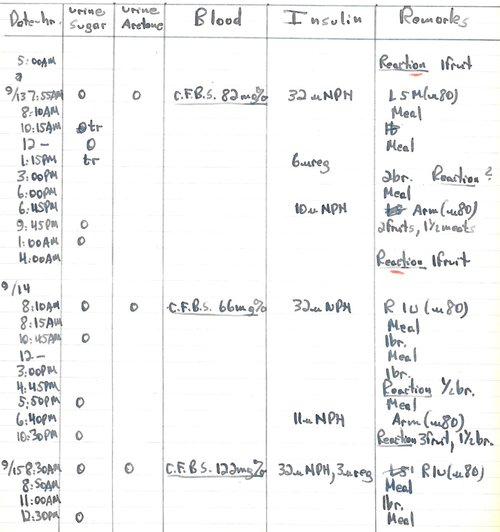
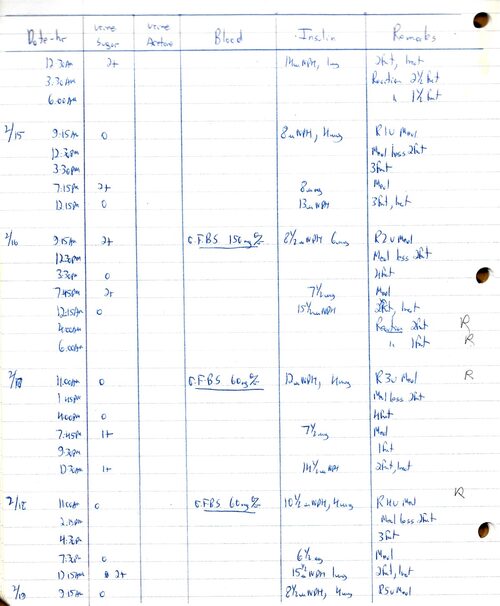
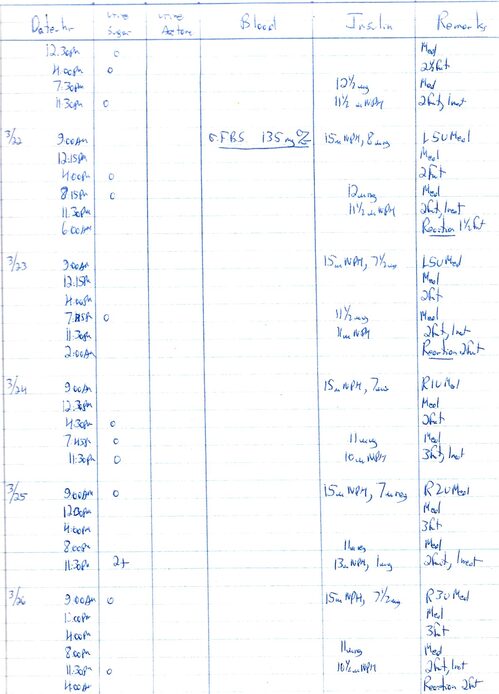
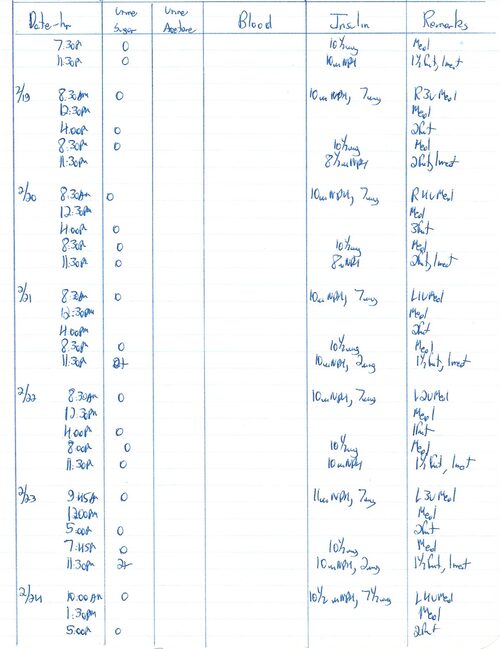
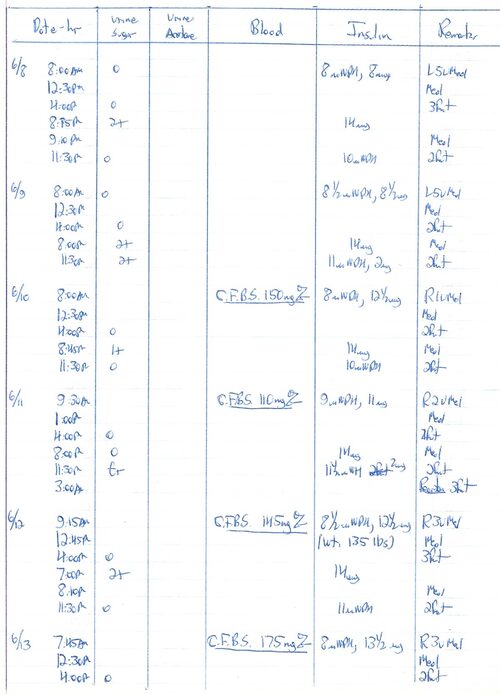
Dr. Alexander Marble, whom Robert consulted as soon as he and Mary Jane moved to Boston, felt that Robert undoubtedly had developed diabetes during the second half of 1954 while he was having the unexplained hypoglycemic reactions and losing about 25 pounds. However, the disease was not recognized until his self-diagnosis in January of 1955. Record keeping in a formal, daily manner did not begin until April of 1955, primarily because he had an operation to remove his bilirubin stone-filled gall bladder which was giving him excruciating pain and would have made his diet very difficult to handle. In addition, he had a post-cholecystectomy syndrome, keeping him in considerable pain. However, once he began to keep these records, he did so faithfully for more than 60 years until a few days before his death in May of 2015. The records presented here are representative of the thousands of pages that accumulated over the more than 60 years. As may be seen from the picture below, the records were initially kept in spiral notebooks, then on three-hole paper for three-ring notebooks.
The early notebooks have relatively short entries, a morning fasting blood sugar obtained in our home laboratory as described in the first section, together with urine sugars obtained with Clinitest tablets added to urine in a test tube. Occasional evening blood glucose determinations were performed at home as needed. Later, when Tes-Tape was available making the urine sugar measurements more sensitive and more convenient, numerous of these are often reported per day and they proved an excellent way of determining when to give extra doses of insulin. The eventual availability of glucometers for measuring blood sugar led to numerous such entries per day. This was particularly important when the insulin pump was employed because it permitted the administration of multiple small doses of insulin as needed during each day and prevented many hypoglycemic episodes. Pencil entries on some pages are MJS’s in preparation for the digitization of the data.
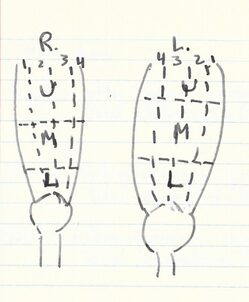
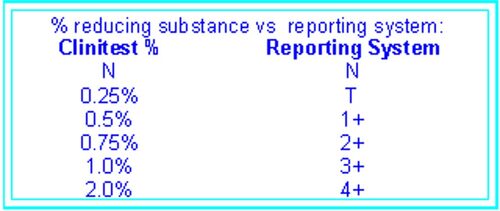
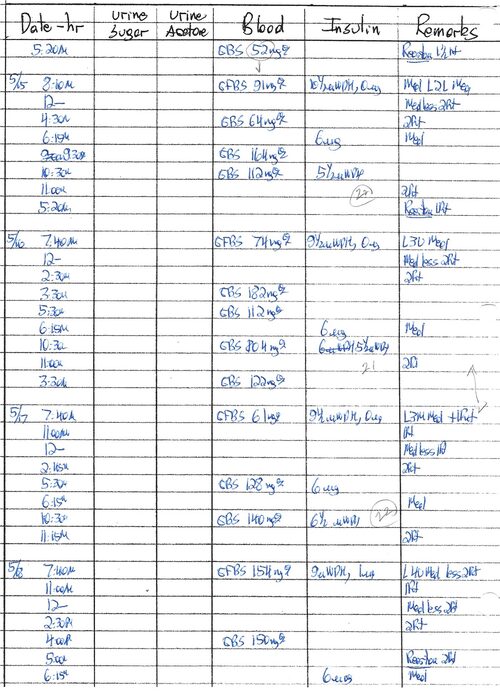
The placement of the injections that Robert gave himself in his leg every morning were changed frequently and in each record there is a notation indicating whether the insulin was injected into the right (R) or left (L) leg, whether it was into the upper (U), middle (M) or lower (L) portion and into which numerical section it was given. The other parts of the early records are the date, time of day, capillary fasting blood sugar determined by the Nelson-Somogyi method, the amount of sugar in the urine on a scale of 0 to 4+, based on color (from blue to orange), with blue being negative, reported as 0, light green as a trace (Tr) and increasing up to 4+ as indicated in the chart below.
The amount of insulin administered is also indicated, as either the intermediate-length of action Neutral Protamine Hagedorn (NPH) or the short-acting regular (reg). Also it should be noted that the terminology for a “fruit” has changed over the years. In these pages, Robert uses the term Fr to indicate 10 g of CHO (not the 15 g of CHO currently used) and he usually drank orange juice to accomplish this. In later years, particularly while using the pump, he often records ½ fruit, or 5 g of CHO for a reaction. His use of the term bread (Br) (old terminology) indicated 15 g CHO, 3 g protein for a total of about 80 cal. Later he employed the term 2 Fr instead.
Pages were chosen from the notebooks of 1955-2014, scanned and inserted in sequential order. Close observation of the entries suggests that one secret to Robert’s success in handling his diabetes was his willingness to take extra insulin because of elevated blood sugars or a positive urine test, despite the fact that in many cases this led to hypoglycemia.
For reasons of space economy the pages shown on this Website represent just a few from the 60 years during which Robert maintained his records. These were selected to show trends, changes, and finally the transition to the insulin pump. A PDF document is available that has a page from every one of the 60 years and this can be obtained by contacting me at spiro.maryj@gmail.com
As a personal comment I would like to state that Robert was an incredible scientist, always evaluating the “current knowledge” and willing to use his own diabetes as an experiment to determine the best method of preventing the devastating complications. It is difficult to comprehend the discipline and devotion to a cause that enabled him to keep his daily record faithfully for more than 60 years.
Page from first record book, 1955
In this early phase of his diabetes, Robert took only the intermediate action NPH insulin and as can be observed, we performed quite a few blood glucose measurements in our home laboratory to help us understand the disease. The Clinitest tablets used in the early years were much less sensitive to sugar in the urine than the TesTape used later, with the urine being 0 even at a blood sugar of 191.
This is a page from January 1956 and by this time the regimen included administering not only the NPH insulin but also regular insulin based on blood or urine sugar levels. It also includes low blood sugars, indicated as Reactions.
September, 1956 Eight months later than the previous 1956 page, Robert was performing many urine sugar measurements and using the information from them to determine extra insulin injections. The nighttime administration of NPH had also become part of the regimen.
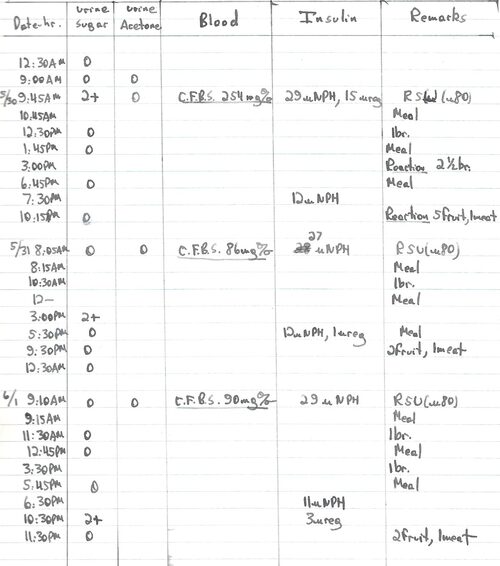
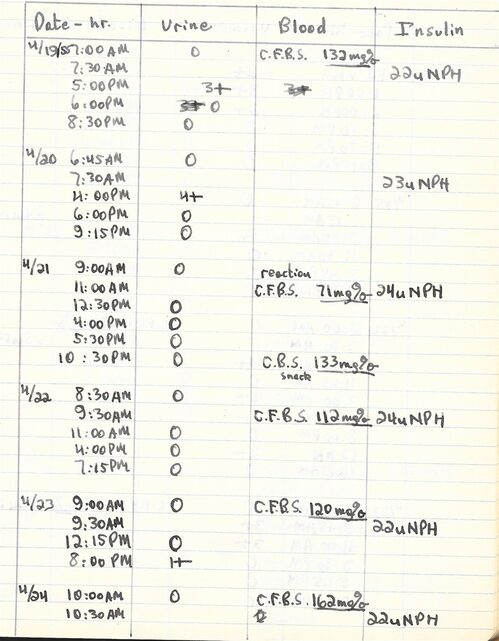
May-June, 1957 Many urine sugar measurements. The consequences of a high blood sugar and the attempt to lower it are demonstrated on this record page where severe hypoglycemic incidents (reactions) occurred because 15 units of regular insulin were taken to normalize a 254 mg/dl blood sugar.
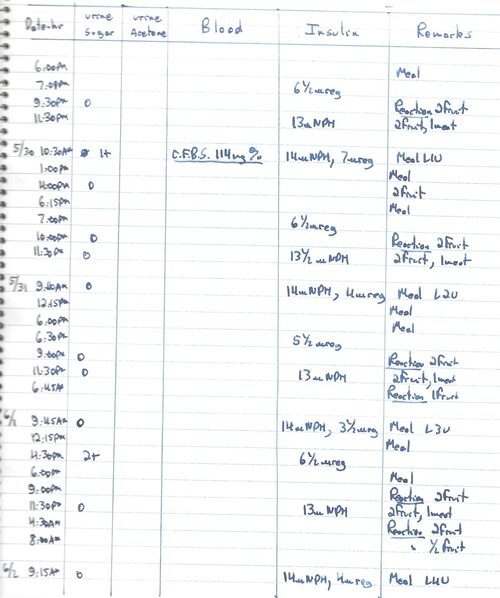
May-June, 1961 Note that while absence of urine sugar, indicated by (0), was used to gauge insulin requirement on several days, its presence (1+) resulted in the performance of capillary fasting blood sugar in our home laboratory (5/30). Many hypoglycemic episodes.
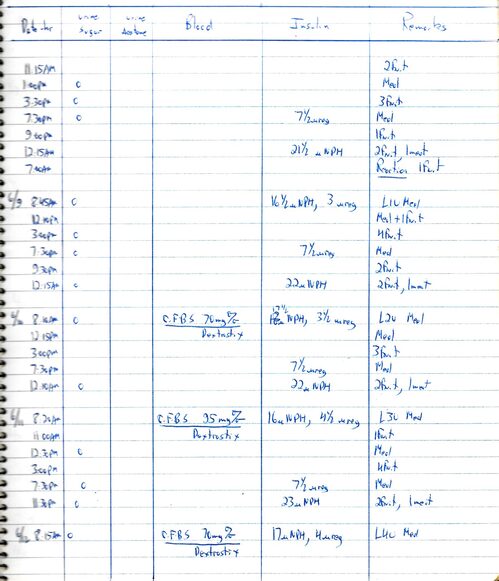
June, 1965 Note the use of Dextrostix for the blood sugar.
January, 1967 Note that blood sugars were carried out on the 14th and 15th because of positive tests for urine sugar. Blood sugar was also determined on the 16th despite the absence of urine sugar (0) since it had been 2+ at midnight. This is one of the values included in the determination of average blood sugar value for (0) urine.
February 1968 Both urine and blood sugars were used to determine insulin dosage at this period. The values for 2/17 and 2/18 were included with other (0) urine values into the calculation of average blood sugars for (0) urines. Similarly the 2/16 value was entered for the 2+ calculations.
March, 1971 During this period Robert depended primarily on urine sugar values plus reactions to let him know where his blood sugar was.
February, 1974
In the 20th year of his diabetes, Robert’s control was based primarily on urine sugar levels and on his experience from previous years of record keeping. It can be seen that this approach was successful, in that there were very few elevated urine sugars. Robert always said that he could detect elevated blood glucose levels as easily as he could the low ones. With his 20 years of experience, any slight changes in his feeling of well-being resulted in his testing his blood sugar
.
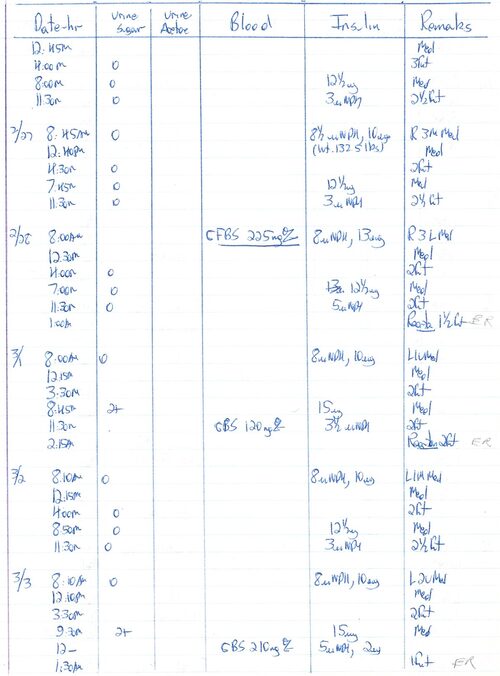
June, 1977 This page shows a problematic week in which there were several high blood sugars, in each case adjusted by administration of extra insulin.
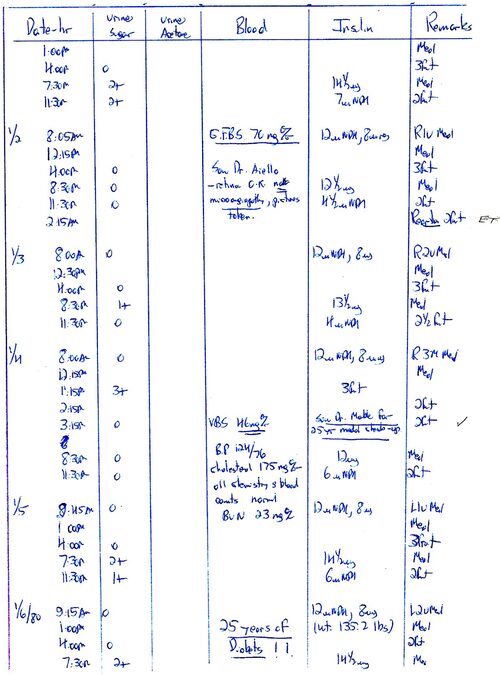
January, 1980 This marked the 25th anniversary of Robert’s self-diagnosis of Type 1 diabetes, although Dr. Marble was convinced that the disease dated from Septemer/October, 1954. At that time the Joslin 25-year medal depended on the absence of diabetic complications. On this page Robert records his visits to Dr. Lloyd M. Aiello who found no lesions in the eyes and Dr. Alexander Marble, who found laboratory data normal, including the BUN, indicating no kidney damage. Robert was very pleased that his efforts had been successful so far and he felt vindicated in his belief in strict control of blood sugars. Note his enthusiastic !!.
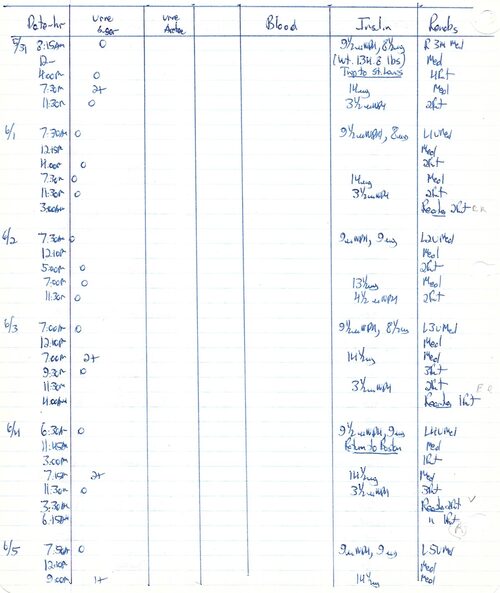
June, 1981 This page shows handling diabetes while travelling (trip to a Federation of American Societies for Experimetal Biology meeting in St. Louis). While he was away from home he did numerous urine tests, but no blood sugar. He had several middle-of-the-night hypoglycemic episodes.
March, 1983 High blood sugars and extra insulin, followed by hypoglycemic episodes.
March, 1988 Many hypoglycemic episodes
August, 1992
May, 1997
May, 1999
Note that there are very few urine sugar measurements in 1999 and subsequent years because Tes-Tape was no longer easily available. Fortunately, by this time there were several excellent glucometers on the market that Robert made use of for blood glucose measurement.
May, 2001
No urine sugar measurements, as mentioned on previous page. This is four months prior to staring use of the insulin pump.
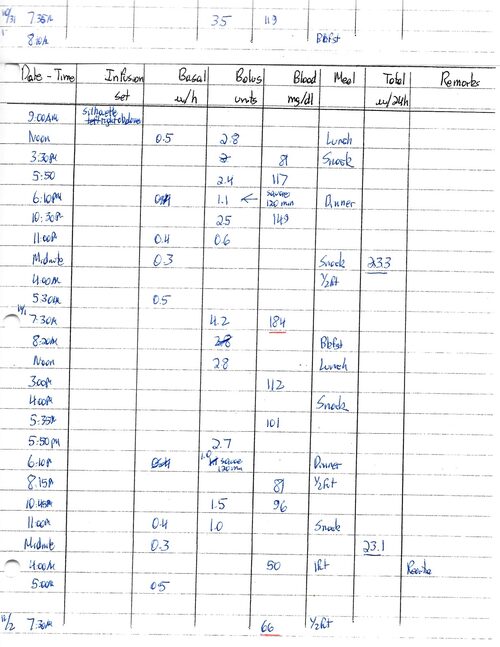
November, 2001
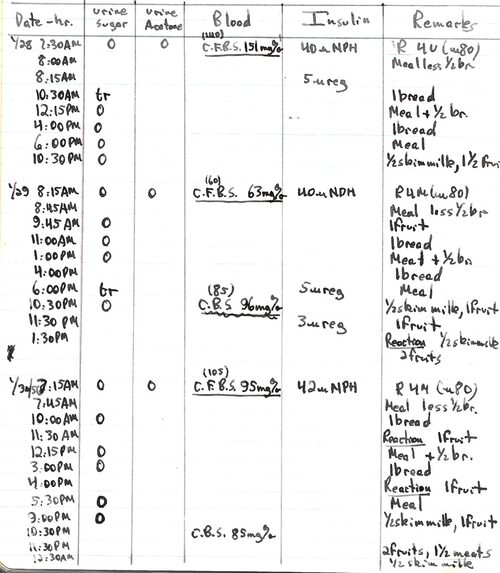
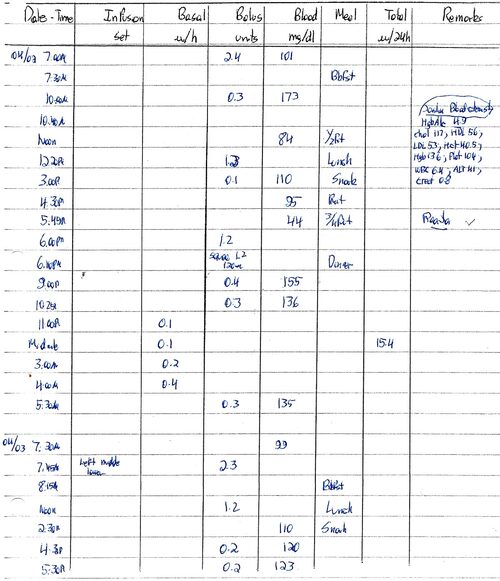
Entries from 10/31 to 11/2. The use of the Mini-Med pump had started in September, 2001. Notice that the entries are different and more detailed, using only Humalog at this point and administering it either as bolus (listed as units given) or as basal (listed as units/hr). The Humalog was eventually changed to Novolog, since the former precipitated at the slow flow rate of the basal dosage Robert was using.
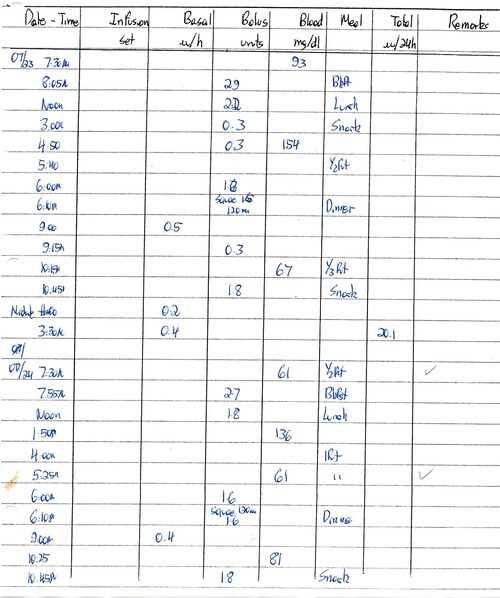
July, 2002
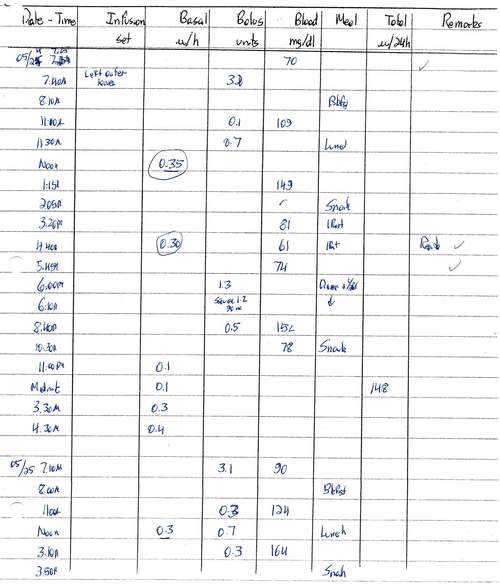
Although the bolus is always indicated at the time it was given, the basal is only indicated when a change was made. For 7/22-23 (not shown) the basal started at 4:00 am and continued at 0.4 units/hr until 9:00 pm, then at 0.5 units/hr until midnight (0.2 units/hr) going back to 0.4 units/hr at 3:30 am. The amount of insulin per 24 hr is read from the pump display. The checks on some lines highlight a hypoglycemic episode to facilitate its entry into the digitized data.
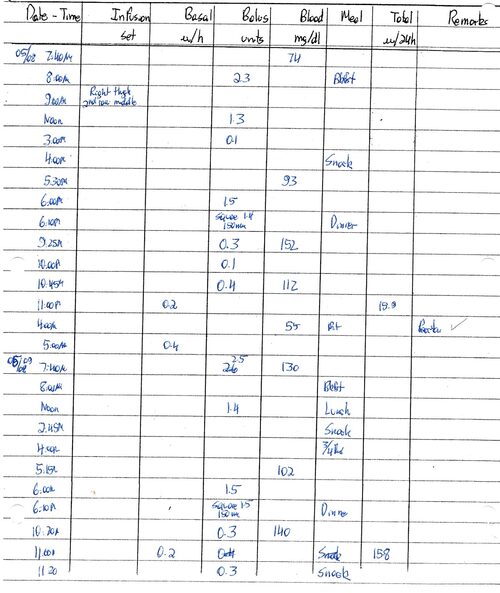
May, 2005
From the note at the top of the 5/08 record it will be seen that the infusion set was now being placed in the leg, according to the pattern described in section I. This change from abdomen to leg was prompted by an increase in the amount of fat produced at the injection site in the abdomen, but not in the leg.
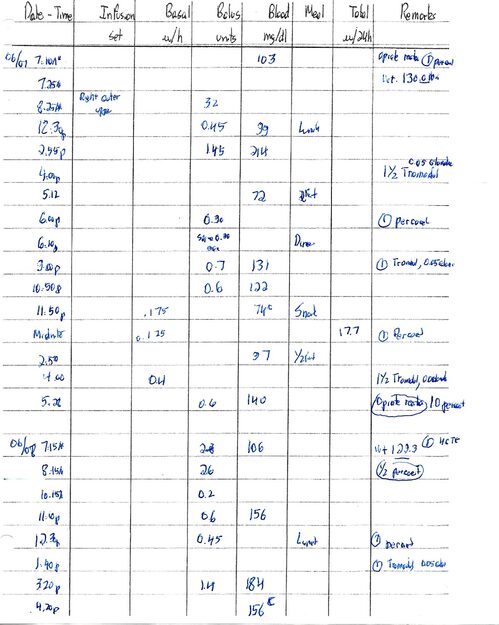
April, 2008
Hemoglobin A1c 4.9 at regular check-up at Joslin. Nine blood sugar measurements 4/02
May, 2010
Note the response to the afternoon hypoglycemia by lowering the basal to 0.3 units/hr
June. 2014
Robert was suffering a great deal of pain from spinal stenosis during this period and was prescribed both tramadol and Percocet. The surgeons he consulted advised against an operation. He was experiencing side-effects from these opiates (termed Opiate reaction).
Section IV – Methods and Calculations
Urine glucose and its significance
Although Dr. Elliott P. Joslin was convinced of the importance of controlling blood sugar, the medical community was only finally convinced by the National Institutes of Health-sponsored study called the DCCT (Diabetes Control and Complications Trial) published in 1993. That study involved 1,441 volunteers who had type 1 diabetes who were either treated conventionally (two insulin injections/day) or who were put on a more stringent schedule with three insulin injections/day and multiple blood sugar measurements. These individuals were evaluated for the complications of diabetes (blindness, kidney failure, and neuropathy) and it was found that the strict control substantially reduced all of these outcomes. The results made clear the importance of monitoring the blood sugar level to prevent hyperglycemia and just as importantly to avoid low blood glucose which if not treated can lead to unconsciousness.
In 1954 when Robert developed diabetes measurement of blood glucose was only carried out in a hospital laboratory and not by an individual at home. However, as the blood glucose rises, a certain amount of the sugar is excreted in the urine. Most individuals have a threshold concentration of glucose in the blood before a sizable amount of this sugar is excreted. Analysis of the urine sugar therefore can give an insight into its blood sugar level.
Test tube reactions - For this reason urine glucose measurement performed at home was the primary technique used in the 1950’s by patients with diabetes. Most commonly employed at the time Robert developed the disease were Clinitest tablets. These involved an anhydrous version of the reagents used in the laboratory for the Benedict’s test: namely copper sulfate, citric acid, sodium hydroxide and sodium carbonate. The development of color depended on the reducing properties of glucose; in the presence of the heat generated by dissolving the sodium hydroxide in the urine, the cupric sulfate (blue) was reduced to cuprous oxide (red) in varying amounts dependent on the amount of glucose, turning the solution from blue to green, yellow, orange and eventually to red.
Tes-Tape - In 1956 a article in Analytical Chemistry by J. P. Comer of the Eli Lilly Laboratory reported that strips of paper impregnated with the enzymes glucose oxidase and peroxidase as well as the dye precursor, o-tolidine, gave a specific semiquantitative reaction for glucose in urine. The action of glucose oxidase on the glucose molecule results in the formation of hydrogen peroxide which in turn is used by the enzyme peroxidase to convert the colorless o-tolidine to a blue dye, the intensity of which is again proportional to the amount of the sugar in the urine. This enzymatically treated paper (commercially known as Tes-Tape) was sold as a roll in a convenient plastic container appropriate for carrying in a pocket. An important thing to remember is that for testing the early morning urine sugar level (to compare it to the capillary fasting blood sugar level) it was necessary to completely empty the bladder of its overnight urine, then to wait for a few minutes before taking a fresh sample for testing. This was the procedure Robert used in the period when he depended more on urine sugar than blood sugar and he became very skillful in assessing the results and using them to determine insulin dosage.
Blood glucose determination
Test-tube reactions - Laboratory test-tube measurement of glucose in blood also depended on the ability of glucose to reduce the blue cupric sulfate to red cuprous oxide, but required first adding reagents to precipitate the proteins, followed by centrifugation to remove the precipitate and leave the clear supernatant for the test.
In 1944 N. Nelson published a colorimetric adaptation of the Somogyi-Shaffer-Hartmann method for determination of glucose in biological materials and introduced the arsenomolbydate reagent. The blue color obtained in this procedure is caused by the reduction of the molybdenum atom in H3AsSO4(MoO3)12 by the cuprous ion. This was the method that we employed at home on small amounts (200 microliters) of blood, using a home-made centrifuge and reagents brought from the laboratory. The color, which was proportional to the amount of glucose present, was initially estimated visually by comparison to a series of glucose standards run at the same time, but was later measured precisely using a colorimeter.
Test strips - Development of test strips containing glucose oxidase appropriate for blood determinations was difficult because of the red hemoglobin of the erythrocytes and the large amount of protein in the serum. However, by 1964 a product from Miles Laboratory (Dextrostix) became available. A drop of blood was added to the strip and after a measured period of time the strip was washed with a stream of water and compared to a color chart provided by the manufacturer. With practice, it became possible to substitute the Dextrostix for the test-tube reaction with an accuracy of 97%. Between 8/2 and 9/20/1964, we performed 21 comparative analyses to obtain the average given above, 97%. The standard deviation obtained in these experiments was 22%, and the standard error of the mean, 4%. This large standard deviation at first seems unacceptable. However, even for today’s advanced glucometers, the manufacturers state that the possible error of their test strips is +/-20%. This allows the determination of whether the blood sugar is closer to 100 (80-120) than for example 200, (160-240) and from the point of determining insulin dosage that is very helpful. Robert’s experience, however, doing duplicate analyses at any given time showed a much smaller error so that he had a great deal of confidence in the results that he obtained.
Glucometers – By the mid 1970’s a number of instruments capable of measuring the intensity of color on strips had been developed by several companies, primarily Ames and Boehringer-Mannheim. Although these instruments were originally large and used only in physician’s offices, they were eventually reduced in size and price and became available for the patient with diabetes. Robert used the Ames Dextrometer first in November of 1980 and its precision is seen in many blood sugar entries after that date that read more exact figures (e.g., 38 mg/dl) instead of approximations (40 mg/dl). As the technology of the meters improved, Robert moved on first to the Bayer glucometers and finally to the One Touch by Lifescan, Inc., a subsidiary of Johnson and Johnson. In 2014 he was using the One Touch Ultra II which requires only about 1 microliter of blood (compared to the 200 microliters we used for the Somogyi method that we used in the early years) and gives the results in five seconds.
Preparation of charts and graphs
The analysis of data from more than 60 years of type 1 diabetes presents a number of problems. There are several periods for which almost daily capillary fasting blood glucose measurements were made: 1955-1960, 1965-1967 and 1999 – 2014. For these years, graphs have been prepared indicating the fasting blood sugar, the daily insulin dose and the number of hypoglycemic reactions. However, for many reasons, including the pressures of an active career (see the addendum giving his curriculum vitae, publications, etc.), other years have fewer fasting capillary blood sugar determinations. In this period the availability of Tes-Tape made it possible to monitor the urine sugar frequently during the day and to take additional doses of insulin when sugar appeared in the urine. Every morning before breakfast the sugar content of fresh urine (preceded by emptying the bladder of overnight urine) was determined with the Tes-Tape and in many cases a fasting blood sugar was done at the same time.
Correlation of zero urine sugar with capillary fasting blood sugar (CFBS).
Although the availability of Dextrostix made measuring the blood glucose much easier, nevertheless the finger pricking to obtain the blood was a painful procedure. Over a period of time we compared the capillary fasting blood sugar (CFBS) by the Somogyi method to a freshly voided (as described above) prebreakfast urine which was negative for glucose U(0), as shown in Table 1 “Correlation of prebreakfast urine glucose U(0) values with CFBS”, with an average blood glucose value of 102 mg/dl for the period 1958-66. A similar comparison was made of all zero value urine sugars (not just fasting) with simultaneously performed blood glucose measurements. For a total of 880 urine/blood comparisons, an average glucose value of 103 mg/dl was obtained when there was no sugar in the urine (SD=36.9, SEM=1.25).
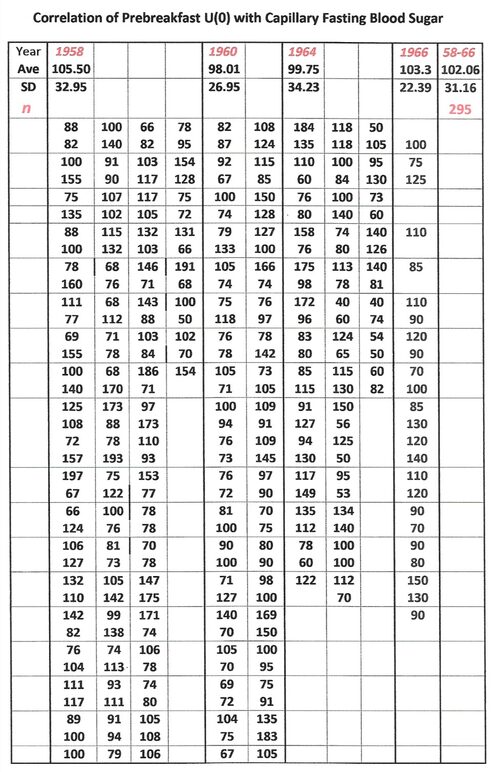
Table 1
Notes: Urine vs CFBS were also determined for 1+, 2+, 3+ and 4+ urine sugar values. The corresponding average blood sugar values were 165, 171, 208 and 260 mg/dl, respectively. Blood glucose levels were also determined for all U(0) values (total of 880) and the average was found to be 103.
In order to determine the average fasting blood sugar for the years when fewer than 200 fasting blood sugars were performed, correction was made by multiplying the number of days when no blood glucose measurement was made (but when the urine sugar was 0) by the value 102 (the average from the measurements made in 1958 to 1966, as shown in Table 1). This amount was added to the total of the values actually determined on the blood that year and the sum divided by the total number of days to obtain the yearly average.
These corrections were necessary since the days on which CFBS was actually determined in these years were those on which either the urine sugar was positive or when Robert was suffering from a hypoglycemic reaction, with the resulting values therefore being either higher than or lower than actuality. With his years of experiencing both high and low glucose values, Robert felt that he could tell when his sugar was elevated. He often commented that he felt as uncomfortable, but in a different manner, when high as when low. Therefore, whenever he believed he was high he did a blood glucose so that he could know how much extra insulin to administer.
Moreover, many times Robert was awakened by the feeling of being hypoglycemic and in those cases a fasting blood glucose determination was not always performed. Table 2 gives the results of morning and later in the day episodes on which the perceived hypoglycemia was coupled with a concurrent blood sugar. The value from the pre-insulin-pump period was used in making corrections. It will also be noted that it is more difficult to perceive low blood sugar while using the insulin pump, with values falling into the 40’s, probably reflecting a slower rate of fall in blood glucose.
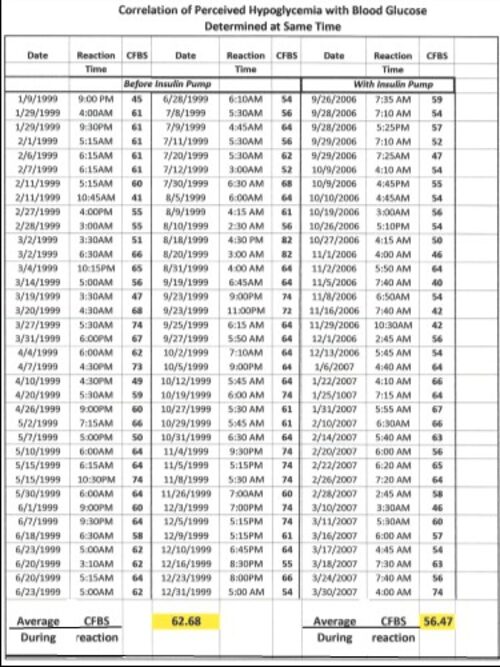
Table 2 Correlation of Perceived Hypoglycemic Incident with Determined
Capillary Fasting Blood Sugar
Table 3A
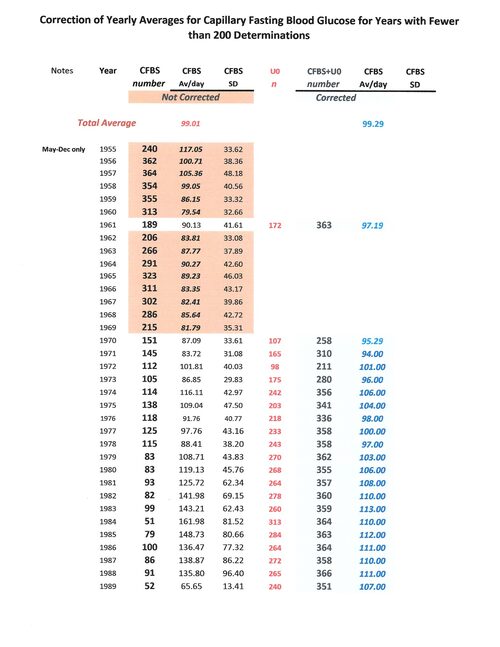
Table 3B

Notes: The numbers in the pink blocks indicate years in which more than 200 capillary fasting blood sugars were performed and no correction was made. The numbers in the blue blocks indicate years in which fewer than 200 CFBS values were determined. Those days without 200 or more blood sugars but with U(0) were calculated as “102” in keeping with the data shown in Table 1. In a very few cases where positive urine sugars were obtained, these were corrected with the appropriate values, as given in Table 1, Notes.
Table 4 Average Daily Insulin Dosage and Hypoglycemia Incidents
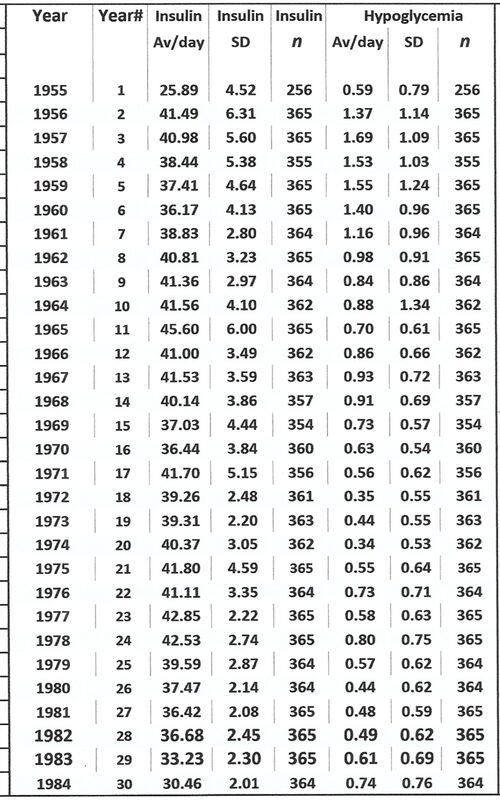
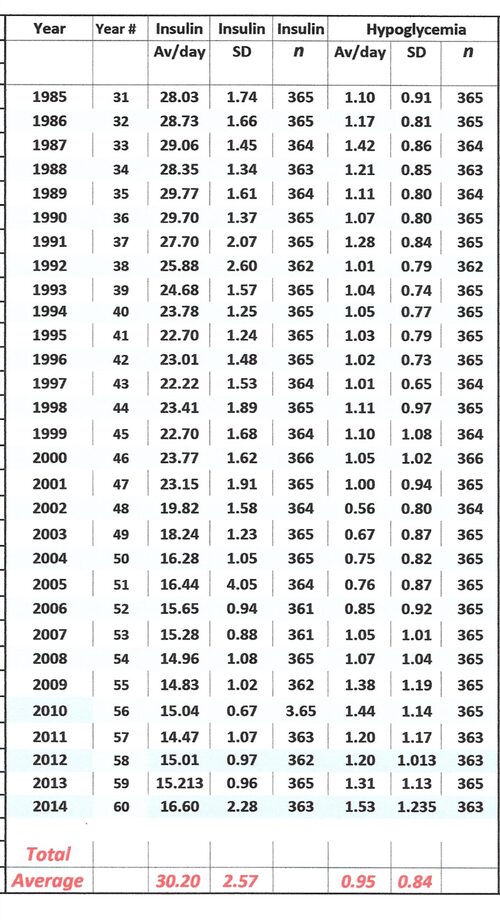
The data shown in Table 4 are presented graphically in: Section I, Figures 4 and 5.
Note: In the case of both the insulin dosage and the number of hypoglycemic episodes, the records are essentially complete, being deficient only in 1955 since record keeping began in April of that year and in 1958 when Robert was hospitalized for acute appendicitis and appendectomy.
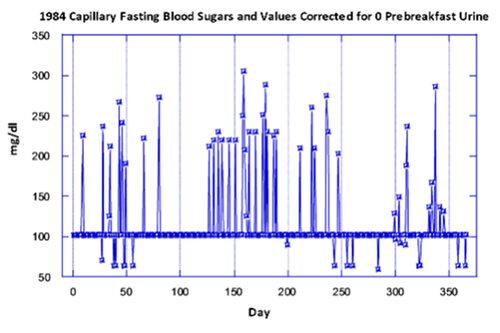
In the next Section a number of graphs will be presented using the data from years when more than 200 daily capillary fasting blood sugars were determined. However below is a graph from the data of 1984 which was a year when the “uncorrected” values showed an extremely high daily fasting blood sugar (see Table 3A). The explanation for this is the fact that on most days only the prebreakfast urine sugar was measured, and on 313 of the 366 days there was no trace of sugar in the freshly voided urine. Therefore, the only days on which the blood sugar was measured were those with a positive test for urine sugar, or for the perception of hypoglycemia. This is illustrated in the graph below, where a straight line of points at 102 mg/dl represent the U (0) days, as explained in the notes to Table 1 of this section. The higher points on the graph represent the days on which the blood sugar was measured because of a positive urine test. The values below the line are from those days when prebreakfast hypoglycemia was perceived and blood sugar measurements were made. This graph demonstrates the importance of making a correction for days on which the prebreakfast urine showed no glucose by entering the value of 102 (from Table 1). Otherwise the fasting blood sugar measurements, made primarily when the urine test was positive for sugar, lead to a high average daily value (in this case 164 mg/dl rather than the corrected value of 110 which takes into account the days with no sugar in the prebreakfast urine).
Section V – Detailed Graphs
As discussed previously, this Section will present graphically the data only from those years during which more than 200 fasting blood glucose levels were determined. Robert for many years found multiple tests of urine sugar to be the most effective manner for controlling his diabetes and one that was more consistent with the very demanding schedule he had to maintain to fulfill his commitments to teaching and research. In Section IV is described the manner in which these prebreakfast urine measurements could be incorporated into the determination of the calculation of the average yearly fasting blood sugar, based on a large number of concurrently measured U (0) and blood sugar levels. These corrected values were utilized for the preparation of the graphs presenting the averages over the course of 60 years.
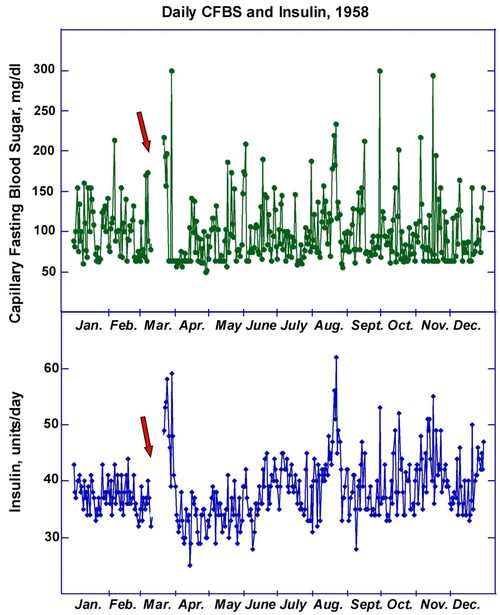
In 1958 the daily fasting blood glucose average was 99 mg/dl while the average insulin requirement was 41 units per day. The arrows show the period in March when Robert was hospitalized for acute appendicitis and had his appendix removed. During these days he was not able to keep his daily record and as can be seen, it took several days after the operation to bring the blood glucose under control.
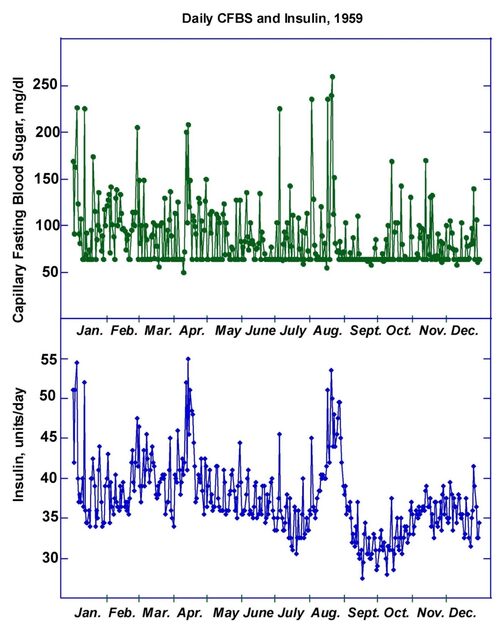
In 1959 fasting blood sugars were performed except for the numerous mornings on which Robert awoke with hypoglycemia. These instances were entered into the record as 63 mg/dl according to the data presented in Section III, Table 2. The large spike in insulin requirement in August is probably related to a period of illness with what appeared to be a viral gastroenteritis with considerable throwing up. Note several very high blood glucose values in that period
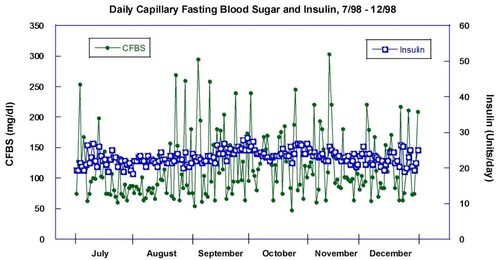
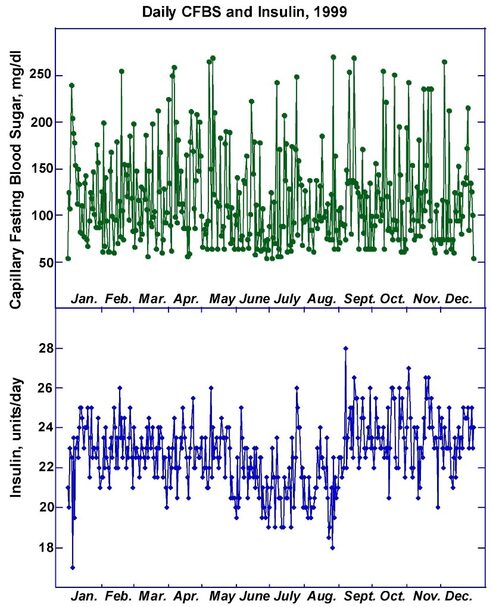
1998 and 1999 represent years shortly before beginning use of the insulin pump. The average daily fasting blood sugar for 1998 was 126 mg/dl while for 1999 it was 116 mg.dl. Although these fasting levels were above the “normal” value, the hemoglobin A1c in 1998 was 6.0% and in 1999, 5.5%, reflecting the administration of small amounts of regular insulin whenever the sugar was high.
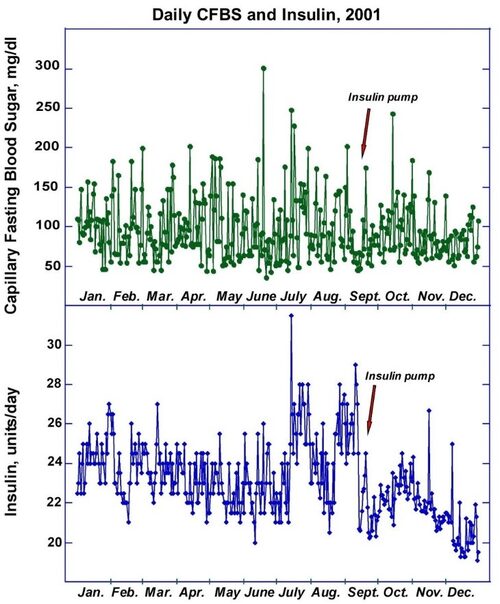
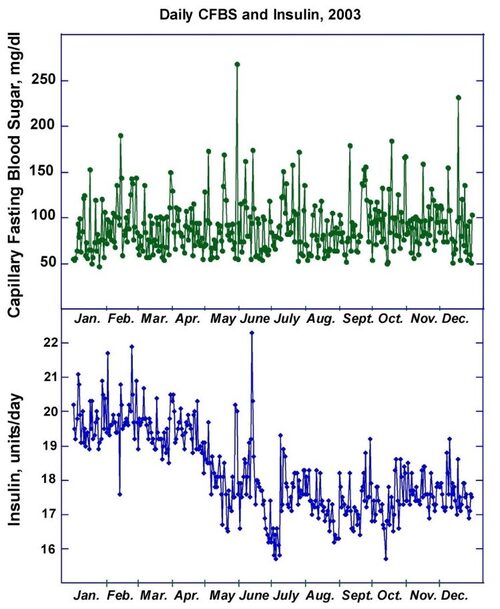
Note after the introduction of the insulin pump in 2001 (upper panel) the insulin requirement dropped precipitously and the fasting blood sugars were closer to normal. The insulin dosage continued to fall in 2003 (lower panel) and again the blood sugar values were closer to normal, the daily average being 95 mg/dl in 2001 and 93 in 2003. Tests for C-peptide prior to obtaining the pump were negative, indicating that Robert was not producing any insulin. Therefore the drop in insulin dosage was due to the manner of administration of this hormone, not to any endogenous production.
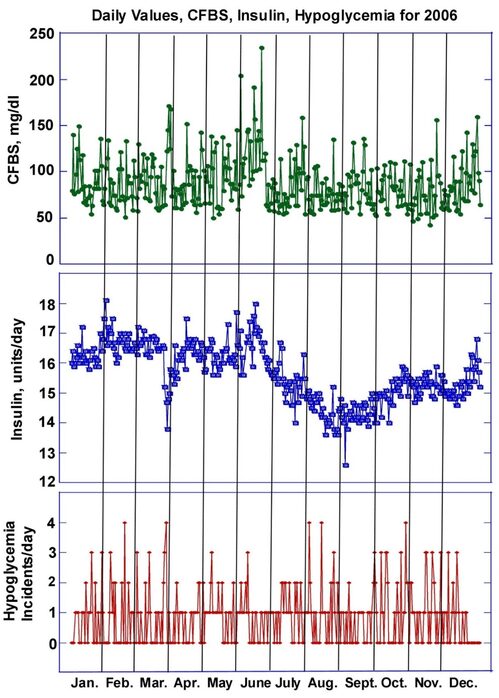
In 2006 the average daily fasting blood sugar was 88 and the insulin requirement varied from 18 to as low as 13 units/day. The improved blood sugars were however accompanied by a large number of hypoglycemic episodes, on some days amounting to as many as four.
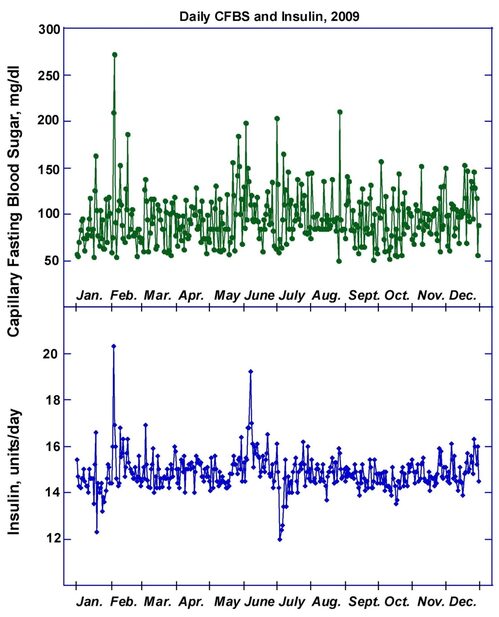
By 2009 the insulin requirement had stabilized and was usually in the range of 14 to 16 units/day, although there continued to be unpredictable spikes and valleys in both the glucose level and the insulin dosage. For the remainder of the 60+ years of the disease both the average sugar values and the average insulin dosage remained similar to those shown in this graph.
Section VI Robert’s Philosophical Approach to Controlling Type 1 Diabetes
Many times over the years Robert reflected on the adversities and blessing one receives during a lifetime. He was born in Berlin, Germany, and as Jews, his family had to flee the Nazis, disrupting the family’s life and his childhood. The other side of this adversity is that while his parents made preparations to flee from Germany they sent him to a boarding school in Switzerland where he got a wonderful welcome, learned to speak French, enjoyed all the subjects included in the curriculum and was started on his way to becoming an academic.
The second adversity was that he was born with a heart condition that would eventually prove lethal if left uncorrected. The blessing side of this was that the doctors did not diagnose it correctly and told his parents that he simply had a murmur that would go away. Because they were not aware of the dangers they did not in any way limit his physical activity and he was able to hike and swim and even work on a farm in the summertime. The young heart was able to compensate for many years, eventually starting to decline in his late 30’s. The additional positive side to this is that during the period when his heart was still compensated, the open-heart surgical technique was being developed and perfected and his interatrial septal defect was successfully corrected in 1971, giving him an extra 44 years of life.
The winter he was applying to medical school he had the misfortune of slipping on ice and breaking his leg, forcing him to use crutches for a time. This made his interview at Harvard Medical School unsuccessful and he went instead to the State University of New York Medical School at Syracuse. The blessing side of this was that he met a classmate, Mary Jane Paisley, with whom he spent 63 years of married life and since she changed from the M.D. to Ph.D. program, he had an in-house chemist when he needed help setting up the home laboratory.
When in the senior year of medical school he realized he had type 1 diabetes, he was not completely overwhelmed. His maternal grandfather had gotten type 1 diabetes late in life and was treated with the newly discovered insulin by Robert’s cousin, Dr. Heinz Wolf, then a resident in a Berlin hospital. For that reason Robert already had an interest in the disease and for the Pharmacology course he wrote an honors thesis on diabetes. In undertaking this project Robert consulted Dr. Elliott P. Joslin’s book on diabetes, which convinced him of the importance of good management of the disease. Therefore, viewing his own disease he decided that much more was known about diabetes than many other illnesses, that it would present a challenge that he could tackle and that research into the complications would be a very stimulating way to spend his life. After postdoctoral training both at Harvard Medical School and then at the Massachusetts General Hospital, he joined the Joslin Research Laboratory. After their first son David was born Mary Jane joined him and they collaborated on the diabetic research projects for 35 years until their retirement in 2000. His optimism was justified and he was able manage his diabetes carefully on a day-to-day basis and to live through 60 years of type 1 diabetes without any complications.
Section VII Research and Academic Activities
In this section I would like to present an understanding of the work that was accomplished by Robert in the years between his receiving his medical degree/Internship at SUNY Upstate Medical Center and his death in 2015.
Robert was dedicated not only to discovering the causes of the diabetic complications, but also to training a new generation of M.D.’s and Ph.D.’s who would continue investigations into relevant topics, not only on diabetes but on other serious diseases. Below is presented a picture of the laboratory in 1988 taken by a Joslin photographer in preparation for an open-house for visitors.
This picture shows post-doctoral fellows from, China, India, Germany (2), Great Britain, Japan and the United States, plus Robert and Mary Jane and a member of the group from Mauritius (Vishnu, on the left, his long-time technician), as well as several laboratory members from the United States.
Over the course of his career he trained approximately 60 postdoctoral fellow and students, the list of which will be found after this introduction. The members of the laboratory were devoted and very hard-working. The protocol for introducing a new fellow or student to the laboratory was as follows: Robert would prepare detailed outlines for two or three projects, based on the individual’s training and interests. Then he would painstakingly go over each with the person and ask him/her to make a choice. One objective of his training procedure was to give each trainee, whenever possible, a solo project so that each would be first author in the resulting publication. He was upset with the current tendency to have multiple authors on a publication, with the responsibility being so divided that each author would not necessarily be able to understand or vouch for what others had done.
After a choice of project had been made, the individual had access to the laboratory supplies, equipment and techniques, with help being available when needed. Robert would request a written summary of results every few weeks and after perusing the data he and the trainee would sit down for an in-depth discussion of the project and how to move forward with it. Another characteristic of his technique was his written questions about the work. Many mornings the first thing the trainee would see on arrival at the laboratory would be several pages of Robert’s hand-written comments and questions, which were likewise to be answered in writing (using the computer was OK).
In addition to the serious scientific side of the laboratory, on many days Robert, Mary Jane, Vishnu and the fellows would gather in his office for coffee and conversation around 6:30 PM. When Robert retired, the Joslin held a special symposium in his honor and at the same time collected letters from previous fellows in which they described their remembrances of being part of the laboratory. Most said that Robert had been a demanding mentor, expecting excellent work from them and then going over their results in depth to be assured of their accuracy. They also said that they had learned the basics of carrying out scientific investigation from him and that they were in turn passing this tradition on to their students. But they also remembered fondly the coffee hour as a time to talk about non-scientific topics and appreciated that all points of view were welcome. Many said that since several different countries were always represented among the lab members, these conversations broadened their “world view” and were enjoyable diversions from the scientific research.
I am presenting some Robert’s career in great detail because I feel it is important for individuals who have diabetes to realize how active and involved they can be. They must of course take very good care of their diabetes, but they should find ways to incorporate their career into their schedule. One thing that Robert did that many people with illness do not do is that he made it very public that he had diabetes and that he was determined to control it. I took a lesson from the wife of George Minot, the physician who won a Nobel prize in 1934 for his work on pernicious anemia. It was said that when the Minots were invited out for a meal, she always contacted the hostess, explaining that her husband had type 1 diabetes and that he might not be able to eat all of the offerings but that she hoped the hostess would understand. I many times made such a phone call and uniformly was met with understanding.
Robert always said, in giving advice to individuals who had just developed the disease, that the family should be a part of their care. If the family is made aware of the consequences of not maintaining control of the blood sugar, that the diabetic family member would develop terrible complications, such as blindness, kidney failure requiring dialysis, or a very painful neuropathy, they would realize that restrictions, such as eating at a scheduled time would be minor compared with the burden of caring for a very ill person.
Postdoctoral Fellows Trained in Robert's Joslin Laboratory
(Updated 12/2015)
|
|
|
|
Country |
|
Name and Degree |
Stay |
Predoctoral |
Current |
|
|
|
|
|
|
John T. Dunn |
1964-66 |
U.S.A. |
Deceased |
|
Suguru Fukushi, M.D. * |
1965-67 |
Japan |
Deceased |
|
Paul J. Beisswenger, M.D. |
1967-69 |
U.S.A |
U.S.A. |
|
Terukatsu Arima, M.D. |
1968-70 |
Japan |
Japan |
|
Billy G. Hudson, Ph.D. |
1968-70 |
U.S.A. |
U.S.A. |
|
Donald L. MacDonald, Ph.D. |
1970-71 |
Canada |
Deceased |
|
Tokutaro Sato, M.D. |
1970-72 |
Japan |
Japan |
|
Anthony M. Adamany, Ph.D. |
1970-74 |
U.S.A. |
U.S.A. |
|
Yumiko Kawai, Ph.D. |
1971-78 |
Japan |
U.S.A. |
|
Robert G. Price, Ph.D. |
1972-73 |
U.K. |
U.K. |
|
Michael J. Levine, D.D.S., Ph.D. |
1972-73 |
U.S.A. |
U.S.A. |
|
John R. Hoyer, M.D. |
1973-74 |
U.S.A. |
U.S.A. |
|
Gideon Kidroni, Ph.D. |
1973-76 |
Israel |
Israel |
|
Terufumi Sawada, M.D. |
1975-77 |
Japan |
Japan |
|
Michael A. Brownlee, M.D. |
1975-77 |
U.S.A. |
U.S.A. |
|
Yoshio Okada, M.D. |
1976-78 |
Japan |
Japan |
|
Michel Sternberg, M.D. |
1976-78 |
France |
France |
|
Daniele Godelaine, Ph.D. |
1978-80 |
Belgium |
Belgium |
|
Noorjahan Panjwani, Ph.D. |
1978-81 |
U.K. |
U.S.A. |
|
Lee A. Murphy, Ph.D. * |
1978-81 |
U.S.A. |
Deceased |
|
Narajahan Parthasarathy, Ph.D. |
1978-82 |
India |
U.S.A. |
|
Kalyan Anumula, Ph.D. |
1978-81 |
U.S.A. |
U.S.A. |
|
Patrick Cammarata, Ph.D. |
1979-83 |
U.S.A. |
U.S.A. |
|
Kiyoshi Miyahara, Ph.D. |
1980-82 |
Japan |
Japan |
|
Barry Kress, Ph.D. |
1980-84 |
U.S.A. |
U.S.A. |
|
Albert S. Edge, Ph.D. |
1980-90 |
U.S.A. |
U.S.A. |
|
Panaiyur Mohan, Ph.D. |
1981-88 |
India |
U.S.A. |
|
Robert J. Chalifour, Ph.D. |
1981-85 |
Canada |
Canada |
|
Algimantas P. Valaitis, Ph.D. |
1982-84 |
U.S.A. |
U.S.A. |
|
Hiroyuki Shimomura, M.D. |
1982-85 |
Japan |
Deceased |
|
William A. Lubas, M.D., Ph.D. |
1982-88 |
Grad.Student |
U.S.A. |
|
Yukinobu Kato (Goso), Ph.D. |
1985-87 |
Japan |
Japan |
|
Bairanje R. Nayak, Ph.D. |
1985-91 |
India |
U.S.A. |
|
Yasuhiro Hosaki, M.D. |
1986-89 |
Japan |
Japan |
|
Thomas Ledet, M.D. |
1986-87 |
Denmark |
Denmark |
|
Stuart S.E. Moore, Ph.D. |
1986-91 |
U.K. |
France |
|
Gundula Kresbach, Ph.D. |
1987-89 |
Germany |
Germany |
|
Guo-Qui Shen, M.D. |
1988-90 |
China |
U.S.A. |
|
Thomas Danne, M.D. |
1988-91 |
Germany |
Germany |
|
Rajesh Kumar, Ph.D. |
1989-90 |
India |
U.S.A. |
|
Catherine Rabouille, Ph.D. |
1989-90 |
France |
Netherlands |
|
Shylaja Dharmesh, Ph.D. |
1989-91 |
India |
India |
|
Yuichiro Yasumoto, M.D. |
1990-92 |
Japan |
Japan |
|
Shuai Weng, Ph.D. |
1990-94 |
China |
U.S.A. |
|
Sen Hiraizumi, M.D. |
1990-92 |
Japan |
Japan |
|
Masanori Wakisaka, M.D. |
1990-92 |
Japan |
Japan |
|
Nimai Chandra, Ph.D. |
1991-94 |
U.S.A. |
India |
|
Paramahans Salimath, Ph.D |
1991-93 |
India |
India |
|
Katsuryo Dairaku, M.D. |
1992-95 |
Japan |
Japan |
|
Qi He, M.D. |
1992-96 |
China |
China |
|
Junko Amano, Ph.D. |
1993-95 |
Japan |
Japan |
|
Ling Na Chen, Ph.D. |
1993-94 |
Taiwan |
Taiwan |
|
Peng Luan, Ph.D. |
1993-94 |
U.S.A. |
U.S.A. |
|
Qin Zhu, Ph.D. |
1993-94 |
France |
U.S.A. |
|
Velislava Karaivanova, Ph.D. |
1993-98 |
Bulgaria |
U.S.A. |
|
Xianwang Meng, Ph.D. |
1995-97 |
China |
U.S.A. |
Teaching and Scientific Lectures
In addition to planning experiments and supervising a large research laboratory, Robert spent a considerable amount of time teaching (Harvard Medical School students) and lecturing at meetings. The latter often required him to travel extensively and to be away from his home surroundings where he had help managing his diabetes. For the individual with diabetes, any time away from home requires a great deal of planning, determining how many syringes, testing supplies, vials of insulin, alcohol swabs for finger pricks and injections, etc., to pack and remember to take. Since Robert was very prone to hypoglycemic episodes, he also had to take carbohydrate-rich cookies or similar packable items for emergencies. If we traveled together I could find a store to buy such things, but when he traveled alone he was more vulnerable and had to plan more carefully. Nevertheless, over the years he managed to take part in many scientific meetings and to go as a visiting lecturer to many institutions, having many hypoglycemic reactions, but none serious enough to require medical attention. His experience shows how a Type 1 diabetic can take care of his illness and still participate actively in his career obligations.
From 1957 when he presented a paper at the annual meeting of the American Society of Biological Chemists in Atlantic City to 2008 in Forth Worth at the annual Glycobiology Meeting he took part about 150 meetings, both in the United States as well as in Canada, Europe, South America and Japan. Among these meetings were the occasions on which he was given an award: 1968, the meeting of the American Diabetes Association in Indianapolis where he received the Lilly award; 1975, the meeting of the European Assocation for the Study of Diabetes in Munich, Germany, where he received the Claude Bernard Award, 1977, the Annual Alumni Meeting at the State University of New York Upstate Medical Center in Syracuse, where he received the Distinguished Alumnus Award, and 2008 at the annual meeting of the Society for Glycobiology in Fort Worth where he received the Lifetime Achievement Award.
Research
The list of Robert’s publications may be found at http://www.ncbi.nlm.nih.gov/pubmed/?term=spiro+rg. These references are in reverse order of publication, the most recent being #1. Since this list gives only the authors, the title, the journal and the date of publication, it is difficult for someone not in the field to understand what a particular piece of research meant and why it was relevant. For this reason I am going to focus on a few of the publications and try to explain why Robert undertook them and what information relevant to diabetes they provided.
Validation of the alloxan-treated rat as an appropriate model for studying diabetes. References #150-148. When Robert finished his medical internship, he was even more interested in diabetes than before because of the two young women he had seen on his rounds who were going blind because of their diabetes which for each had been only of about 20 years duration. He searched for a laboratory interested in diabetes and found that Professor A. Baird Hastings at Harvard Medical School and his M.D. fellows had studied many aspects of the metabolism of the liver of the diabetic rat. Robert joined that group in July, 1956, having obtained a fellowship from the American Cancer Society. At that time there was a controversy among investigators about whether the rat made diabetic by administration of the chemical alloxan was truly just diabetic or whether the alloxan had poisoned some other cells of its body besides the insulin-producing pancreatic beta cells which were particularly sensitive to this drug.
Robert’s approach to this problem was to first make the rat diabetic and then to treat it with insulin until its blood sugar was normal for a period of time. The transformation was amazing. The sick rats were scrawny, despite having free access to food and water, and their coats were not healthy looking, being somewhat yellow-tinged. After the insulin treatment he had “super rats”; they had gained weight, their coat was a glossy white and they looked alert and very healthy (the rat does not seem to suffer from hypoglycemia, probably because he just eats more to maintain his blood sugar).
When Robert studied the livers of the insulin-treated diabetic rats and compared them to normal, there were no differences whereas the untreated rats had the completely abnormal findings previously shown in the Hastings’ laboratory for this diabetic liver. This indicated that what the alloxan-diabetic rats suffered from was only an insulin deficiency due to destruction of the beta cells by the chemical and was important because it validated the use of the alloxan-diabetic rat in future experiments.
Pathways of glucose metabolism. References 146 & 145 Since most of the early studies carried out in the diabetic animal measured the formation of glycogen (the glucose storage molecule), Robert asked the question “Are other pathways of glucose metabolism similarly affected?”
The diabetic complication that Robert concentrated on initially was the kidney damage that led to renal failure. In 1936 Drs. Paul Kimmelstiel and Clifford Wilson published microscopic pictures of the kidney in diabetic nephropathy showing the destruction of the filtration apparatus (glomerulus) by deposition of an amorphous material. Later studies showed that these deposits (called Kimmelstiel-Wilson nodules) stained positively for carbohydrate. Robert postulated that the elevated glucose found in diabetes might in some way be responsible for these carbohydrate-containing nodules.
When proteins have carbohydrate as part of their structure, they are termed “glycoproteins”. In the 1950’s very little was known about glycoproteins except for a study in 1938 by Dr. Albert Neuberger that showed the presence of sugars in ovalbumin, including glucosamine, a product of glucose metabolism. When Robert used radiolabeled glucose to study the formation of glucosamine in the intact animal he found that although glycogen synthesis was impaired, glucosamine production was normal, suggesting to him that there is more than one pathway for handling glucose in the body. In this manner the elevated glucose in the diabetic animal could enter tissues through pathways not dependent on insulin and lead to an overproduction of harmful compounds. This study was presented at a 1959 meeting of the New York Academy of Sciences and received great attention, leading to many new experiments. That is really the way research works. One individual makes a discovery and many others adapt it to their own investigations, building bit by bit a structure of knowledge.
Model glycoproteins: fetuin, thyroglobulin, α2-macroglobulin. References 144-133 Since, as has been mentioned, there was very little knowledge about glycoproteins in the 1950’s and 1960’s, Robert had no way of knowing what kind of molecule was being deposited in the kidney. He used as his models for studying glycoprotein structure fetuin (a protein abundant in fetal blood of ungulates with a similar protein also occurring in human blood), as well as thyroglobulin, the hormone-containing molecule from the thyroid, and α2-macroglobulin, a human blood component. Each of these proteins could be isolated in a pure form and their study represented pioneering work in the glycoprotein field, describing the nature of the sugar complexes attached to the proteins and over many years the enzymes involved in their synthesis. These studies (which are considered basic science) turned out to be extremely important to many medical problems. For example References 60 and 39, published with Drs. Herzberg, Edge and Kahn, showed that the molecule on the cell surface that interacts with insulin, (the insulin receptor) is a glycoprotein.
The research on fetuin and thyroglobulin indicated that these model glycoproteins contained two types of very complicated carbohydrate units, shown below.
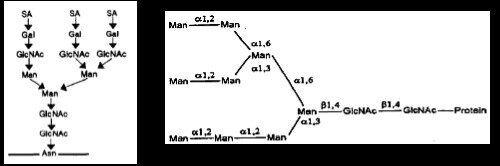
Figure 1
Carbohydrate Units B (Complex) and A (High Mannose)
The sugars contained in these units are sialic acid (SA), galactose (Gal), N-acetylglucosamine (GlcNAc), mannose (Man). Linkage to the protein is through the amino acid asparagine (Asn). (One example of medical relevance - The sialic acid of cell surface glycoproteins represents the site to which the influenza virus binds).
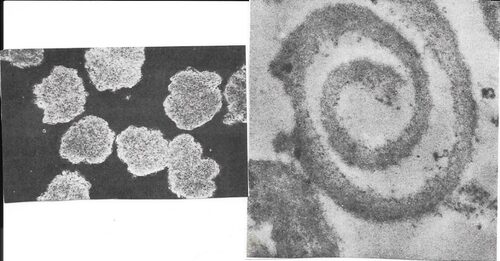
Glomeruli Basement membrane
Figure 2
Isolation of the glomerulus and its basement membrane. References 131-129 In order to study the glomerulus and the nodules that form in them in the diabetic state it was important to have a method to isolate this filtration apparatus from kidneys. For this purpose beef kidneys were brought from the slaughterhouse and a technique was developed using a series of sieves of sequentially smaller sizes until the very small glomeruli were isolated in purified form. A picture of such isolated glomeruli is shown in Fig. 2 (left) as well as after sonication to disrupt cells, the basement membrane (right) that separates the cells of the blood vessels from those of the kidney tubules and therefore represents part of the filtration barrier that keeps the blood proteins in and lets the waste material through.
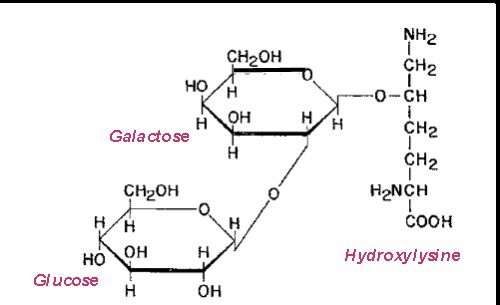
Figure 3
After the purified basement membrane was isolated, it was possible to determine that it consists primarily of a specialized type of collagen, termed Collagen IV, which has substantial amounts of carbohydrate attached to the peptide backbone. A unique type of carbohydrate unit was found, namely a disaccharide, glucosylgalactose attached to the amino acid, hydroxylysine.
Synthesis of the carbohydrate of the basement membrane and the effect of diabetes.
References 114-111, 105-103. After the enzymes responsible for forming this unusual carbohydrate unit, glucosylgalactosylhydroxylysine, were studied, the enzyme adding the outer sugar, glucose was measured in normal and diabetic rats and found to be substantially increased in the diabetic kidneys, suggesting the extra synthesis of basement membrane in these animals. Treatment with insulin prevented this elevation of glucose transfer to the protein, which was interpreted as evidence that the elevated glucose in the diabetic blood played a role in the formation of the material found in the Kimmelstiel-Wilson nodules of diabetic nephropathy. This was one of the earliest studies showing the importance of blood sugar control and it received much attention and changed some minds about the importance of controlling the blood sugar of a diabetic.
Reference 85-86 Moreover studies with alloxan-diabetic rats using radiolabeled amino acids indicated that formation of the peptide portion of the basement membrane was substantially enhanced in the diabetic animal.
Reference 82 showed that the carbohydrate associated with the basement membrane consisted not only of the glucosylgalactose disaccharide but also of a complex unit (shown in Figure 1) and that both of these types of units were present on the same peptide chain. The positive staining of the nodules by the Schiff periodate reaction could be attributed to both types of carbohydrate units.
References 71-70 showed the presence in the basement membrane of a proteoglycan, a highly charged molecule which plays an important role in the blood filtration process in the kidney. In diabetic basement membranes this compound was found to be substantially reduced, possibly contributing to the passage of albumin from the blood into the urine.
Further studies on the asparagine-linked carbohydrate units
The early studies from the laboratory focused on determining the nature of the carbohydrate units present in glycoproteins. However, beginning with a 1965 publication, investigations were carried out to determine the manner in which the sugars are added to the proteins. References 125-124 studied the action of the enzymes that added the outer two sugars, sialic acid and galactose, to the complex unit (Fig.1).
References 102, 94, 68-67 The synthesis of the inner part of the unit was found to be an extremely complicated process involving a structure similar to that of the carbohydrate portion of the high-mannose unit (Fig.1) attached to a phosphorylated lipid carrier. In addition a sequence of three glucose molecules were added to one of the mannose chains, and without this glucose the carbohydrate unit could not be attached to the protein backbone.
Reference 66 Other enzymes then modified the transferred unit to its final structure. This last point turned out to be pivotal in the formation of many proteins, since if the carbohydrate units were not processed properly because of a lack of the required enzyme or some inhibitor, the protein would be destined for destruction and not be available for its function.
Reference 64 showed that man and other animals differ in the nature of the carbohydrate units of their glycoproteins with all studied except humans having galactose attached by an alpha linkage to their carbohydrate units. This turned out to be critical in the use of animal tissues for transplantation into humans since the human has antibodies against the alpha-galactose and rejects the transplant, including insulin-producing islets. Dr. Weir’s laboratory encountered this problem when trying to use pig islets for transplantation.
Basement membrane synthesis in cultured glomerular cells
Reference 31 Techniques were developed for obtaining pure cultures of all three cell types from calf glomeruli, epithelial, mesangial and endothelial cells, as shown in Figure 4.
The advantage of studying cells in culture is that the medium to which they are exposed can be changed many times in order to determine the effect of a particular condition. All three of these cell types were exposed for a period of 60 hours to either 5 mM glucose (normal) or 30 mM (high) and their production of type IV collagen (basement membrane collagen) measured. At 30 mM the amount of type IV collagen formed was double that produced at normal levels. In addition, restoring such high glucose cells to normal glucose reduced type IV collagen production almost to normal.
Reference 27 These three cell types were similarly exposed to different levels of glucose and then back to normal in order to study the production of Type VI collagen, another protein found in sclerotic glomeruli. In this study, Both Type IV and Type VI collagens were formed at an increased rate in high glucose, the Type VI was already elevated after 24 hr exposure while Type IV responded more slowly. Both rates of synthesis decreased almost to normal on return to 5mM glucose.
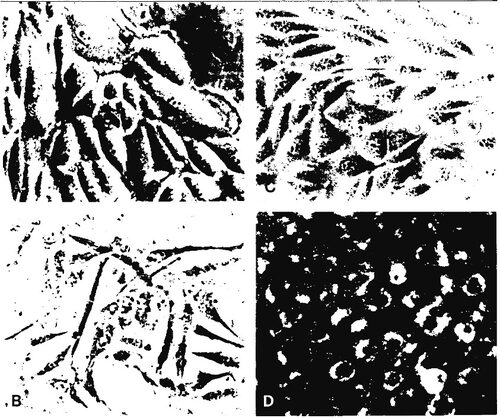
Figure 4
Left, epithelial cells (top) Right, endothelial cells unstained (top)
Mesangial cells (bottom) endothelial cells stained with labeled LDL (bottom)
I would be happy to answer any inquiries about this website. I can be reached at spiro.maryj@gmail.com